
Chainlink Price Prediction: Are LINK Futures Traders Giving Up?

0
0

Is LINK sliding toward $10.599, or are sellers already running out of fuel? Derivatives data from October 29, 2026, 08:15 UTC points to the second answer.
This Chainlink price prediction stays bearish under $11.819, though the selling is thinner than the chart suggests.
LINK trades at $11.36, down 3.43% in 24 hours. The Selig keynote preview covers what traders expected today.
LINK Price Today and Market Snapshot
CoinMarketCap data ranks Chainlink 14th, with an $8.5B market cap and a 24-hour range of $11.29 to $11.94.
Volume jumped 39.04% to $312.52M, so the LINK price fell on busier trading.
Bitcoin lost 1.52% at $79,814.52. But the CMC20 index slipped only 1.19%, so LINK fell 2.9 times as hard.
Why LINK Is Moving Today
Chainlink put S&P Global Ratings vault risk assessments on-chain. They're live on Base, covering the $10B lending vault market, per Chainlink's announcement.
Price didn't care. A 4-hour wick tagged $11.995, early on October 29, 2026, and sellers answered by the next candle.
Link: NYC Goes Live Today
Link: NYC goes live today, October 29, 2026. Speakers from DTCC, Swift, Fidelity, and ICE are on the bill.
Chainlink will stream it on X and YouTube, per its livestream post.
Event days bring noise. Headlines land fast. And reversals land faster.
LINK Technical Analysis on the 4-Hour Chart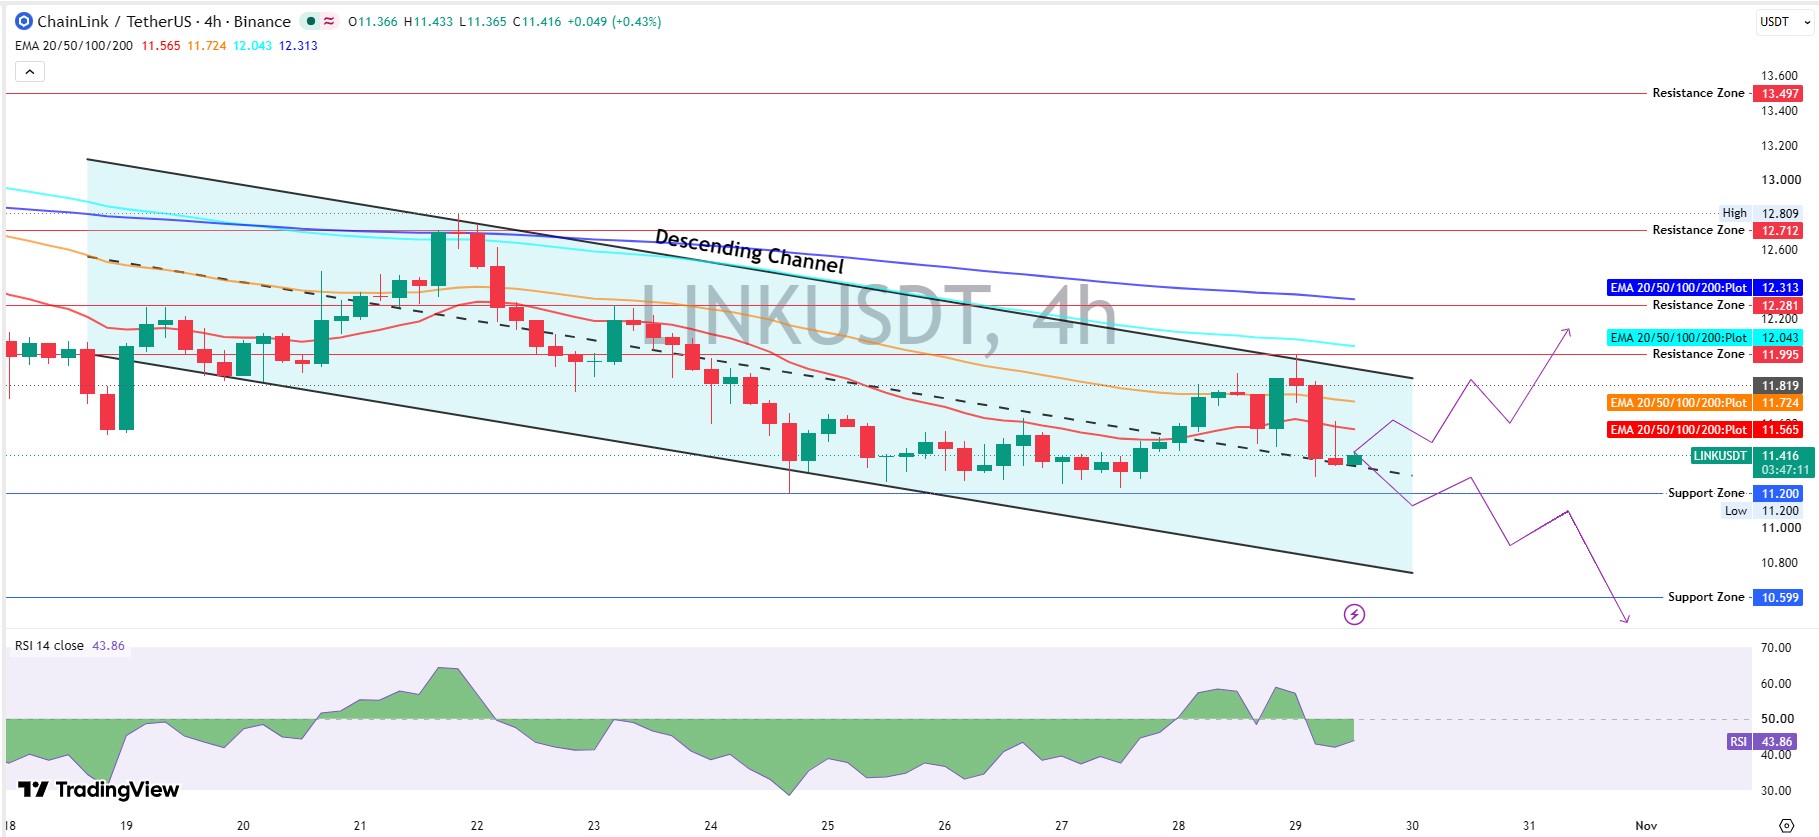
The TradingView 4-hour chart on Binance shows a descending channel that caps every bounce.
Price sits on the dashed midline at $11.416. Buyers pushed through it once already, as the channel breakout setup showed.
EMAs, moving averages that weigh recent trades harder, stack in bearish order. The 20 EMA reads $11.565, the 50 EMA $11.724, the 100 EMA $12.043, and the 200 EMA $12.313.
Price trades under the full stack, so $LINK technical analysis favors sellers.
RSI reads 43.86. Below 50 favors sellers, and the earlier oversold breakdown call flagged similar weakness.
Momentum is bearish. Actually, scratch that. The 90-day gain of 34.60% says buyers still own the bigger trend, so this is a lean, not a collapse.
$LINK Support and Resistance Levels
Buyers defend $11.20 first, the marked support zone, and the recent low. Dip buyers from the reserve buy bounce need to show up here.
If $11.20 gives way, the chart has a single marked floor left. $10.599.
Sellers wait at $11.724, $11.819, $11.995, and $12.043. This $LINK support and resistance map is tight, with $11.20 below and $11.724 above.
Open Interest Falls While Volume Jumps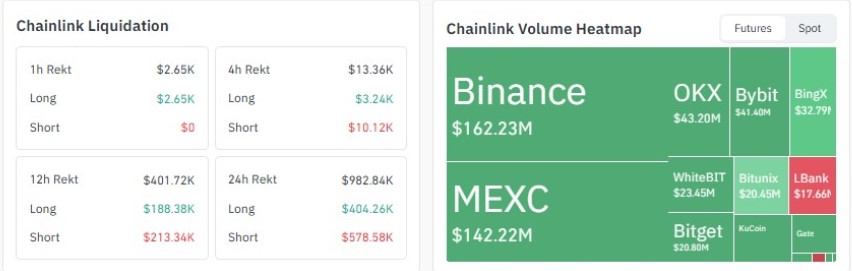
CoinGlass derivatives data puts 24-hour futures volume at $541.41M against $65.26M in spot, a gap of 8.3 times.
Binance LINK/USDT volume rose 70.65% to $148.35M, yet open interest, the total value of open contracts, fell 4.97% to $91.85M.
That split has a simple reading. Unwinding.
Liquidations agree. Shorts lost $578.58K in 24 hours and longs lost $404.26K, so both sides got flushed.
But the long/short ratio on Binance still reads 1.694, so longs outnumber shorts by roughly 1.7 to 1.
Whale Wallets Still Hold the Weight
The whale holder analysis explained how thin books react.
Etherscan counts 4,005 whale-tier wallets, only 0.44% of holders, yet they control 90.54% of market cap.
But Binance Cold Wallet 28 holds 34.69M LINK, and exchange wallets are where selling starts.
Spot ETF Flows Say Little
SoSoValue ETF data shows $0 net inflow on October 28, 2026, the 8th flat session, since a $397.26K outflow on October 16, 2026.
Value traded jumped to $7.39M from $2.37M a day earlier, so buying and selling offset each other.
A bounce needs something that's missing. Spot ETF demand.
So who buys $11.819 if spot volume stays at $65.26M a day?
Chainlink Price Prediction Scenarios
This Chainlink price prediction covers the next 24 to 72 hours from October 29, 2026, 08:15 UTC. Bears hold the edge, and no path here is guaranteed.
Scenario | Trigger | Target | Invalidation | Liquidity Condition |
Bear | 4-hour trade under $11.20 | $10.599 | Trade back above $11.724 | Open interest stays low, spot thin |
Base | Range of $11.20 to $11.819 | Same range | Break of either edge on volume | Volume near $312.52M |
Bull | 4-hour trade above $11.995 | $12.281, then $12.712 | Trade back under $11.724 | Spot volume rises, ETF inflows return |
$LINK Price Forecast Through November
Next 24 hours, expect $11.20 to $11.819, with event headlines adding noise.
A 4-hour trade under $11.20 targets $10.599, a 6.7% drop from $11.36.
November depends on whether the 200 EMA at $12.313 flips to support. The November price outlook mapped the wider range.
Can $LINK Reach $12?
A move to $12 needs a 5.6% climb from $11.36, past $11.819 and $11.995 on rising spot volume.
And ETF flows at $0 make that harder.
But a 4-hour trade above $11.995 would be the first real proof, with $12.281 next.
Risks to the Chainlink Price Prediction
Bitcoin comes first. $LINK fell 2.3 times as hard as Bitcoin's 1.52% drop.
Fresh adoption headlines, like the LG CNS partnership, need volume behind them, and a sold-the-news reaction could erase any bounce.
Bottom Line on $LINK
This Chainlink price prediction stays bearish under $11.819 and turns bullish only on a 4-hour trade above $11.995, with $12.281 next.
Spot buyers decide what happens at $11.819.
Disclaimer: This article is for information only and isn't financial advice. Crypto prices swing fast, and scenarios aren't guarantees. Research independently before any trade.
0
0

 Manage all your crypto, NFT and DeFi from one place
Securely connect the portfolio you’re using to start.


