
Solana Price Prediction: Can Rising Activity Lift SOL Past $111?

0
0

Solana just logged its busiest quarter of the past year. So why is the coin sitting near $104?
Activity is up. Price isn't. An earlier $109 support call flagged $108 as the floor buyers needed to defend. Sellers took it anyway.
Solana Price Prediction Today: Market Snapshot
The $SOL price today sits at $104.64, down 1.02% in 24 hours, per CoinMarketCap data. Readings reflect 06:45 UTC on October 20, 2026.
Metric | Reading |
SOL price | $104.64 |
24-hour change | -1.02% |
24-hour volume | $2.35B (+8.23%) |
Market cap | $61.68B |
Circulating supply | 589.49M SOL |
Volume rose while price slipped. That points to active sellers, not absent ones.
Network Activity: Busiest Quarter in a Year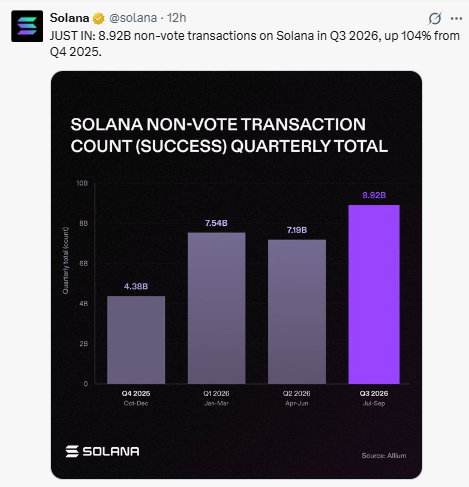
Solana reported 8.92B non-vote transactions in Q3 2026, up 104% from Q4 2025, per Allium data. Non-vote strips out validator housekeeping, so the count tracks app and user activity, bots included.
But busy doesn't equal bid. Solana network activity feeds the Solana price prediction only when fees and demand follow.
Solana ETF Outflows: Eleven Straight Red Sessions
Solana ETF outflows reached $6.72M on October 19, 2026, per SoSoValue ETF data. Bitwise's BSOL led with $4.88M, and Fidelity's FSOL added $1.84M.
Eleven trading days in a row have printed outflows since October 5, roughly $57M by the daily figures. The last inflow was $1.30M on October 2.
SkyAI Sells Its SOL Stack: Breaking Report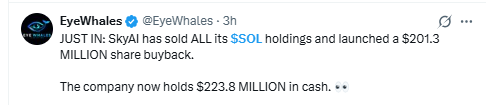
EyeWhales reported on X that SkyAI sold all its $SOL holdings. A $201.3 million share buyback followed. Cash on hand now: $223.8 million. Sale price? Undisclosed. Timing? Unclear. Still, a company dumping its entire stack never helps sentiment.
Derivatives Data: Longs Still Crowded
Futures volume hit $5.07B against $449.70M in spot, with open interest at $6.35B, per CoinGlass derivatives data. Binance accounts run 2.406 longs per short, and top traders sit at 2.7023. A ratio above 1 means longs outnumber shorts.
So who's betting on a rebound? Liquidations reached $5.42M in 24 hours, with longs absorbing $3.07M. And crowded longs on a falling chart tend to get squeezed first.
On-Chain Check: Whale Wallets
Solscan holder data shows the top 10 wallets hold 8.88% of the total supply, about 56.46M SOL. Binance's wallet alone holds 11.18M.
Exchange wallets store customer coins, so big balances don't point to a dump by themselves. But Upbit's hot wallet holds 7.49M SOL, so transfers there deserve attention.
Solana's own tracker price market cap is at $66.54B because it uses total supply, hence the gap versus $61.68B above.
Solana Technical Analysis: Descending Channel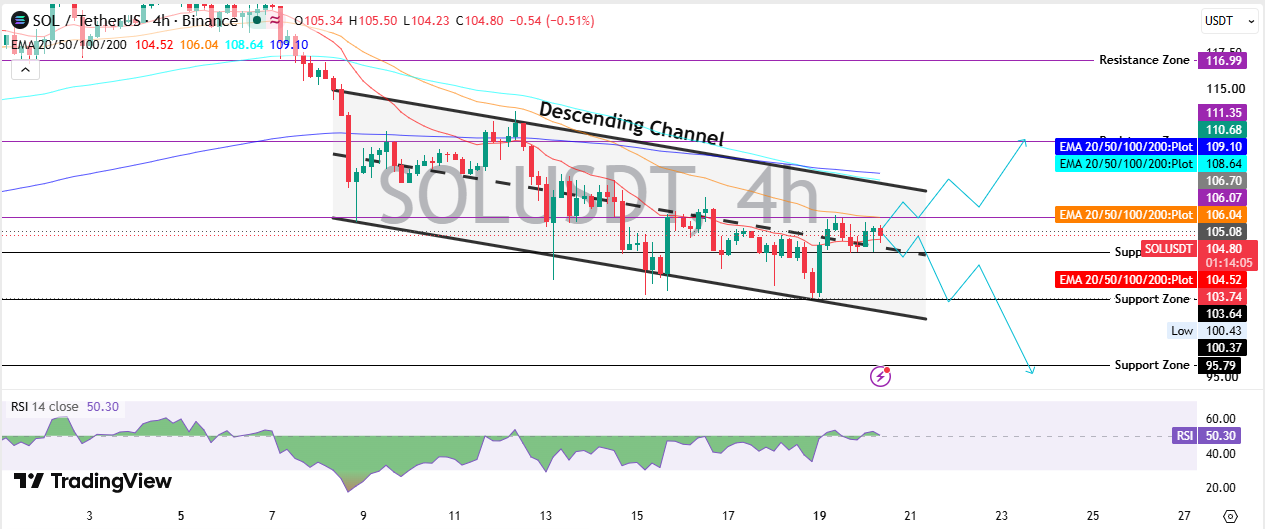
Solana technical analysis on the TradingView 4H chart shows a descending channel since early October. That's a pair of falling trendlines pinning price between lower highs and lower lows. SOL trades at $104.80 inside it.
The 20 EMA, 50 EMA, 100 EMA, and 200 EMA sit at $104.52, $106.04, $108.64, and $109.10.
SOL trades just above the 20 EMA and under the other three. Rallies keep meeting overhead supply. RSI measures 50.30; neither side is winning, so no reversal signal exists.
SOL Support and Resistance Levels
SOL support and resistance come straight from the chart. Support sits at $103.74, then $100.37, then the $95.79 zone.
Resistance starts at $106.04, stacks up near $108.64 to $109.10, then $111.35. The $116.99 zone caps the chart above that.
Solana Price Prediction Scenarios
This SOL price forecast covers three paths. Each needs a trigger, and each has a point where the idea fails.
Scenario | Trigger | Targets | Invalidation | Liquidity |
Bull | Trades above $106.04, volume rising | $109.10, $111.35, $116.99 | Trades below $103.74 | ETF outflows slow, shorts liquidate |
Base | Trades between $103.74 and $106.04 | Midline near $105.08 | Trades outside the range | Volume near $2.35B, longs crowded |
Bear | Trades below $103.74 | $100.37, then $95.79 | Trades above $106.04 | Outflows persist, long liquidations grow |
Bullish Scenario
A trade above $106.04 with rising volume. That opens $109.10 first, then $111.35. A repeat of the September breakout attempt needs inflows back first.
Base Scenario
SOL chops inside the channel while RSI hovers near 50. The buy-the-dip debate stays open here.
Bearish Scenario
A trade below $103.74 with volume. That puts $100.37 in play, then $95.79, a bearish downside case that crowded longs could speed up.
Solana Price Prediction 2026: Year-End Range
A 4-hour chart can't carry a year-end call alone. SOL is down 15.89% year to date but up 34.06% over 90 days, per CoinGlass.
The Solana price prediction 2026 range: bullish toward $116.99 if ETF flows turn positive, base between $100.37 and $111.35, bearish below $95.79. The full 2026 outlook goes deeper.
Can Solana Reach $200?
Can SOL reach $200? That needs a rise of about 91% from $104.80, lifting the market cap near $117.9B from $61.68B.
ETF outflows and a falling channel argue against it soon. But a 34.06% jump in 90 days shows SOL can move fast. The $200 rally case tracks the longer view.
Risks That Could Change the Outlook
ETF outflows could stretch further. Crowded longs could unwind. Corporate selling, like SkyAI's, could repeat.
If the channel floor breaks. Then every level below becomes a magnet. And fresh headlines in the latest crypto market news can flip the mood fast.
Final Takeaway
The Solana price prediction stays bearish-tilted while SOL trades inside the channel and under $106.04. Busy chain, soft price.
Rallies face supply until fees and flows catch up. A trade above $111.35 would change the tone, and a trade below $103.74 would confirm the slide. More forecasts sit in the latest crypto price predictions hub.
Disclaimer: This article is for informational purposes only and isn't financial advice. Levels and scenarios rely on technical chart analysis and public data at the time of writing. Crypto markets move sharply, and past patterns don't guarantee future results. Readers should do their own research before acting.
0
0

 Manage all your crypto, NFT and DeFi from one place
Securely connect the portfolio you’re using to start.


