
Solana Rallies as Schroders Launches Fund: Can SOL Break $98 Next?

0
0
Solana is trading at $96.68, up 3.7% on the day, as crypto markets bounce. The move follows news that Schroders is launching its first fund on the network.
Traders now want to know if SOL can clear a key resistance zone. For now, the chart still leans bearish.
Crypto Market Rally Gives Solana a Lift
The wider market moved higher after Democrats won control of both houses of the US Congress in the midterm elections. Total crypto market cap rose 2.4% to $2.76 trillion.
Bitcoin gained 2.5% to about $80,440. Ethereum climbed 4.20%, XRP rose 3.20%, and Cardano added 3.80%. SOL, BNB, and Dogecoin each gained about 2% to 4%.
Schroders Brings a $1.1 Trillion Name to the Network
On 4 November 2026, Schroders launched its first fund on Solana through Centrifuge. It is an actively managed emerging markets debt strategy, offered in tokenized form.
Schroders manages $1.1 trillion in assets. For Centrifuge, this is a clear adoption signal from a large traditional finance firm. It may also point to demand for the CFG token.
The news alone does not change the chart. Still, it adds to the story that big institutions are testing blockchain rails.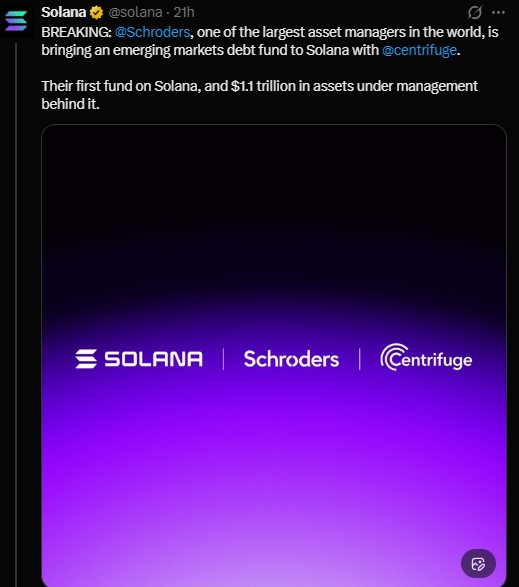
SOL Derivatives Data Shows Mixed Positioning
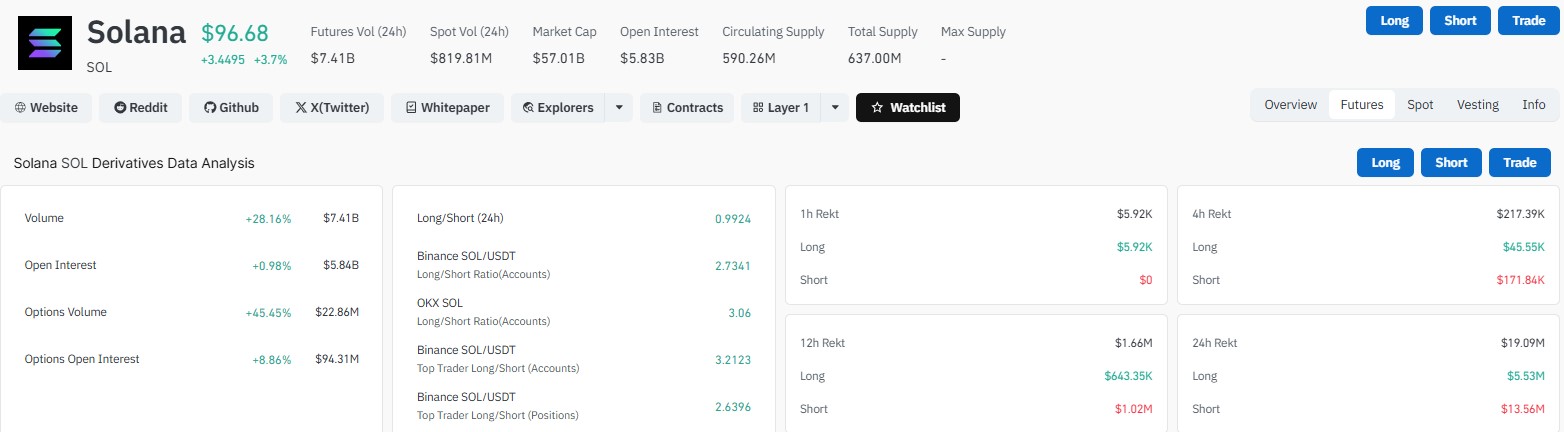
As per CoinGlass data, SOL has a market cap of about $57.01 billion and a circulating supply of 590.26 million. Futures volume over 24 hours is $7.41 billion, up 28.16%. Spot volume is $819.81 million.
Open interest sits at $5.83 billion. Options volume jumped 45.45% to $22.86 million, and options open interest rose 8.86% to $94.31 million.
The overall long/short ratio is 0.9924, which is close to balanced. Account ratios look more bullish, though. Binance SOL/USDT shows 2.7341, and OKX shows 3.06.
Binance top traders show 3.2123 by accounts and 2.6396 by positions.
Liquidations hit $19.09 million in 24 hours. Shorts lost $13.56 million, while longs lost $5.53 million. Short sellers took the bigger hit as price bounced.
Derivatives Metric | Value | 24h Change |
Futures Volume | $7.41B | +28.16% |
Open Interest | $5.83B | +0.98% |
Options Volume | $22.86M | +45.45% |
Options Open Interest | $94.31M | +8.86% |
Long/Short Ratio (24h) | 0.9924 | N/A |
24h Liquidations | $19.09M | Longs $5.53M / Shorts $13.56M |
SOL Technical Outlook: Still Below All Four EMAs
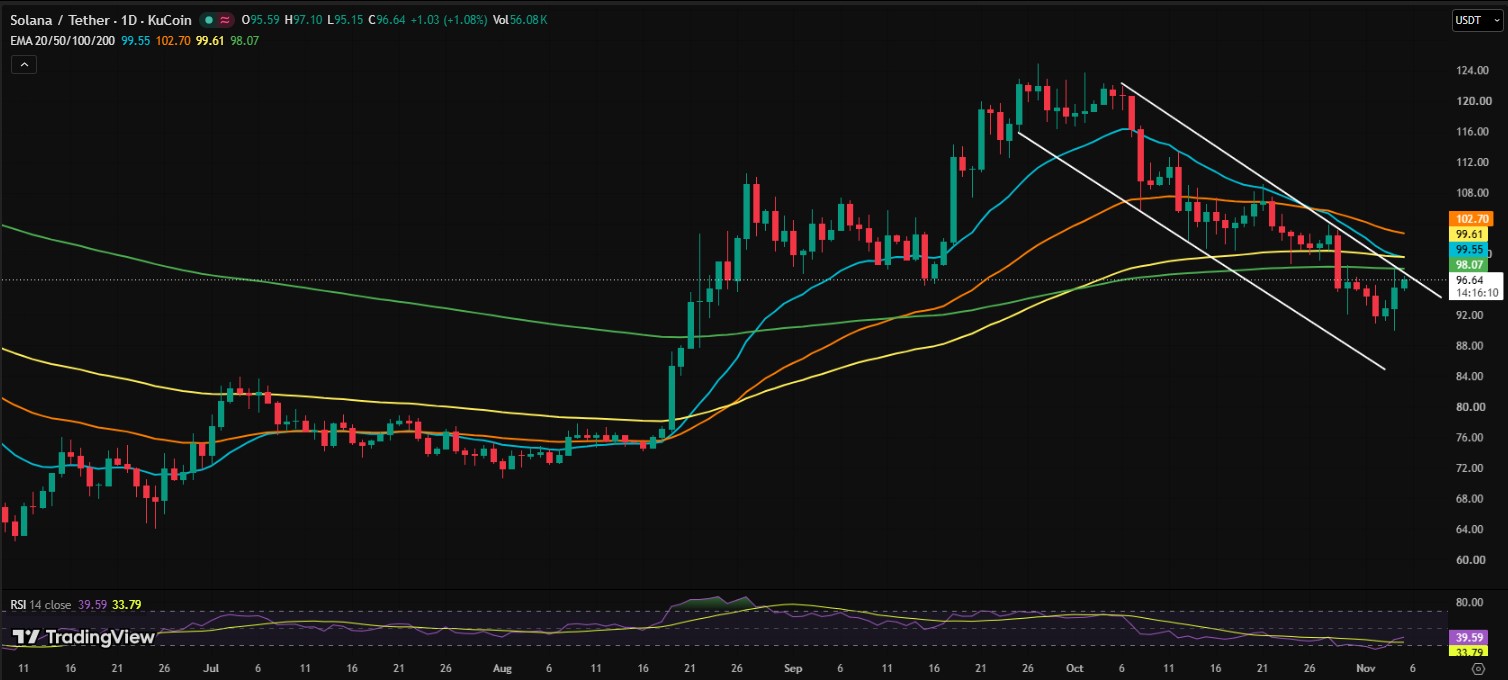
The daily SOL/USDT chart shows price near $96.64. It is trading below the 20, 50, 100, and 200 EMA lines.
$SOL was rejected at the 200 EMA on 30 October and again on 4 November. That makes the 200 EMA a key hurdle.
Price also remains inside a descending channel with lower highs. Sellers still look in control.
The RSI is near 39.59 and has started to recover from oversold levels. That is a good start, but it is not a clear trend change yet.
Solana Price Levels to Watch
If SOL fails to break the 98 to 100 resistance zone, more downside is possible. Support sits near $92 first, then the $88 to $85 area.
On the upside, a decisive move above the 200 EMA and the channel top would help. A push beyond $100 to $103 could weaken the bearish setup and open a short-term recovery.
Level | Type | Note |
$102.70 | Resistance | 50 EMA |
$99.61 | Resistance | 100 EMA |
$99.55 | Resistance | 20 EMA |
$98.07 | Resistance | 200 EMA, rejected twice |
$92 | Support | First downside level |
$88 to $85 | Support | Deeper support zone |
Overall, the outlook for Solana stays bearish until SOL reclaims the 200 EMA and breaks out of the descending channel. Elevated liquidations and mixed positioning also suggest sudden swings are possible.
Disclaimer
This article is for information only and is not financial advice. Cryptocurrency trading carries a high level of risk, and prices can move fast. You can lose some or all of your money. Always do your own research and speak with a licensed financial advisor before making any investment decision. No outcome is guaranteed.
0
0


 Manage all your crypto, NFT and DeFi from one place
Securely connect the portfolio you’re using to start.


