
Bitcoin Drops Below $80,000 After Hawkish Fed Hold: What Next for BTC?

0
0

Bitcoin fell below $80,000 during Thursday's session. It slid from above $81,700 to near $79,800 and ended a two-day rebound.
Tech stocks led the drop. The Fed's tough tone a day earlier added to the pressure.
BTC now trades at $79,776, down 1.61%, or $1,305.41, over 24 hours. Its market cap is $1.60 trillion.
Samsung Miss Sours Tech Mood, Dragging BTC Lower
Samsung shares fell more than 5% in Asia. Its chip unit missed high expectations.
The unit's operating profit rose 15-fold to 106.5 trillion won for the three months through September. Analysts had expected 108.5 trillion won.
Samsung also said capital spending may reach 84.4 trillion won, about $63 billion. That is up roughly 60%. Group net income still rose 39%.
South Korea's Kospi fell more than 2%. Nasdaq futures dropped 1.4%. ETH (now $2,308), XRP, and SOL slipped too.
Fed Holds at 3.75% to 4% With Two Dissents for a Hike
The Fed held its rate at 3.75% to 4% on Wednesday. Markets expected that.
The vote was 10 to 2. Lisa Cook and Beth Hammack wanted a 0.25-point hike.
The statement said the economy is expanding at a strong pace and inflation remains elevated. Chair Kevin Warsh said inflation is improving, but prices are still rising too fast.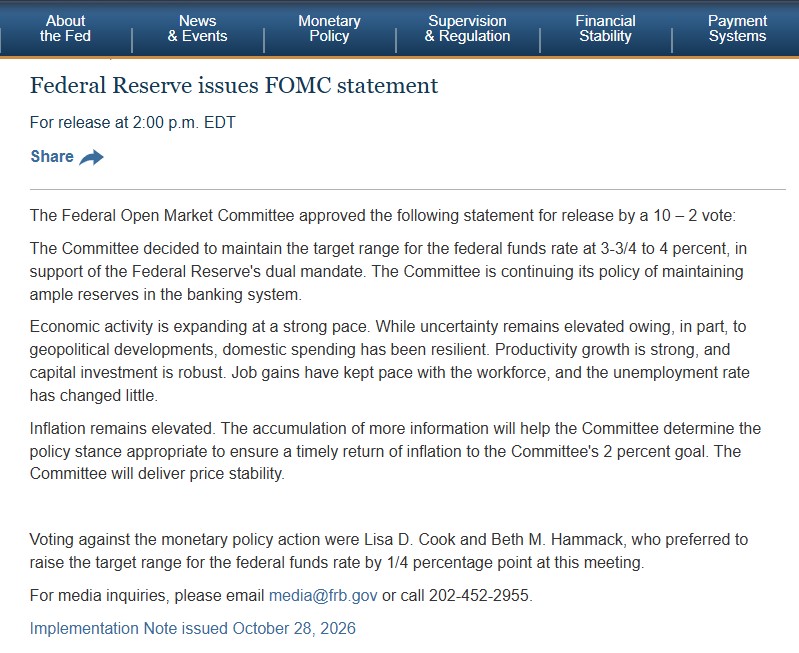
The 10-year Treasury yield briefly rose above 5%. Higher yields make safer assets look better next to risk assets like BTC.
ING still expects another hike in December, after September's.
Traders Price 78.4% Odds of December Rate Hike
Markets say a hike is likely. CME FedWatch data for the December 9 meeting shows this:
Target Rate Range | Now | 1 Day Ago (Oct 27) | 1 Week Ago (Oct 21) | 1 Month Ago (Sep 28) |
3.75% to 4.00% (current) | 21.6% | 16.2% | 10.3% | 5.0% |
4.00% to 4.25% | 78.4% | 78.3% | 76.1% | 36.3% |
4.25% to 4.50% | 0.0% | 5.5% | 13.6% | 58.7% |
The odds of no change have crept up from 5.0% a month ago. A bigger move to 4.25% to 4.50% has dropped from 58.7% to zero.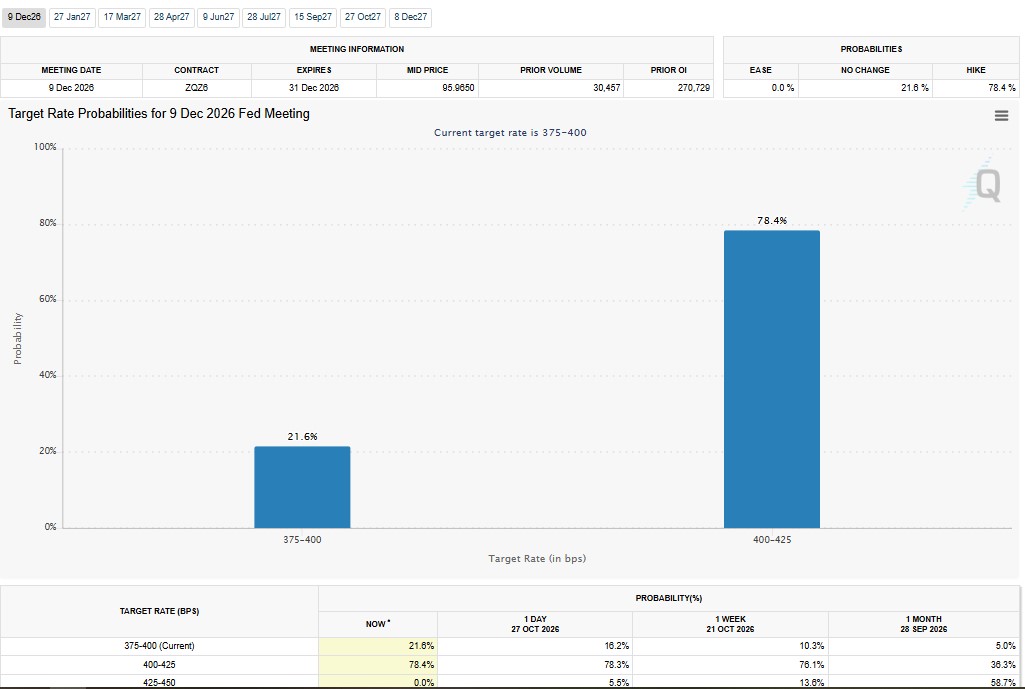
Spot ETFs Draw Just $1.32 Million as Flows Stall
Flows were close to flat on October 28. Spot Bitcoin ETFs took in just $1.32 million, as per SoSoValue.
Cumulative net inflows stand at $57.47 billion. Total net assets are $104.27 billion, or 2.37% of BTC's market cap. Value traded was $1.26 billion.
Only Bitwise's BITB saw money come in, at $1.32 million (16.27 BTC). Every other fund showed $0.00. Fund prices rose between 0.92% and 1.05% on the day.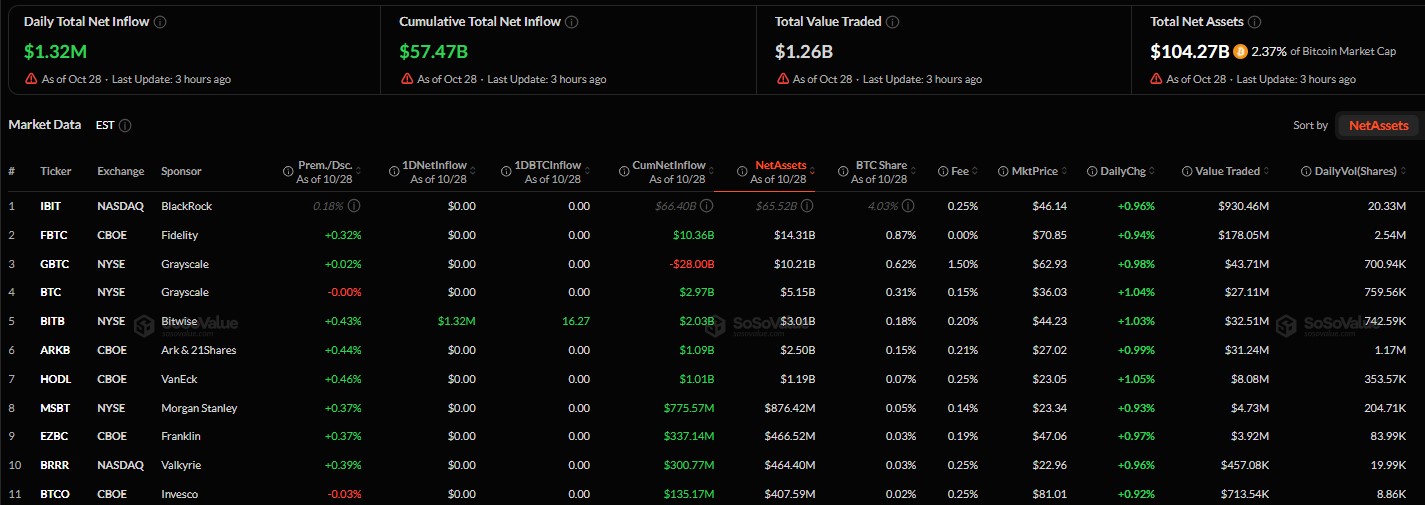
On-Chain Activity Stays Flat, Santiment Data Show
Not really. Some bulls, including those answering Jason Calacanis, point to rising on-chain use. Santiment says the data looks flat.
Weekday Average | Oct 14 to 27 | July to September |
BTC transactions | 271.8K | 278.8K |
Active addresses | 637K | 662K |
Early October did run hotter, at 295.5K weekday transactions. It has since faded back to the summer range.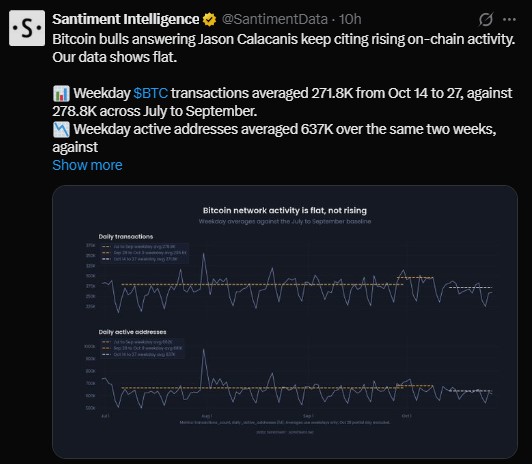
Longs Bear the Brunt of $94.58 Million in Liquidations
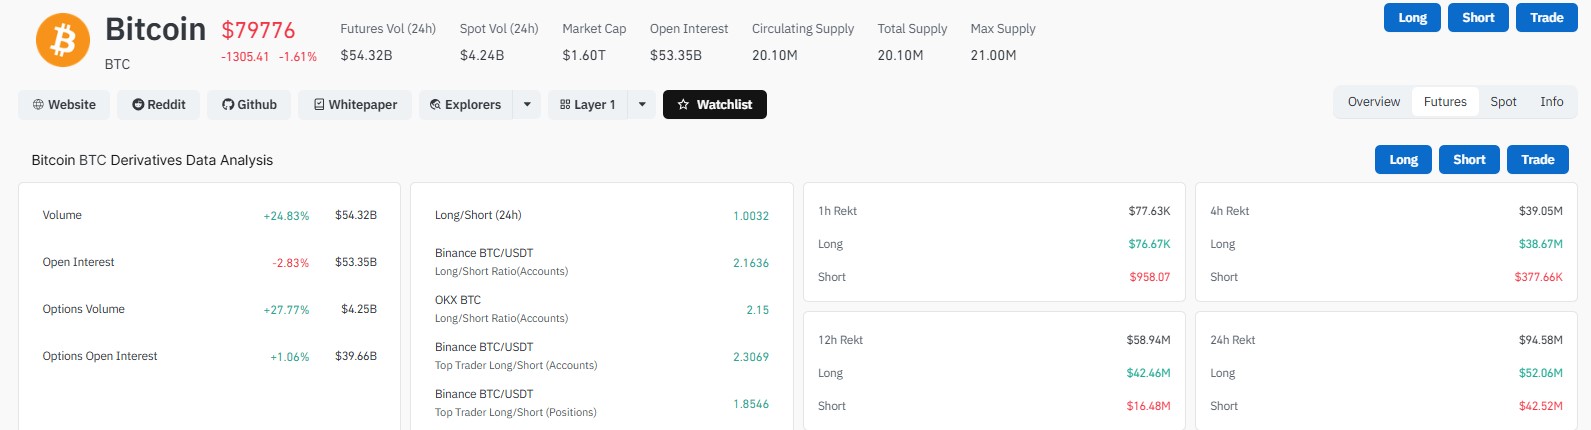
Futures volume rose 24.83% to $54.32 billion. Spot volume is only $4.24 billion. Open interest fell 2.83% to $53.35 billion.
The 24-hour long/short ratio is 1.0032, which is nearly balanced. Binance accounts show 2.1636, and OKX shows 2.15. Binance top traders show 2.3069 by accounts and 1.8546 by positions.
Metric | Value | Change |
Futures volume (24h) | $54.32B | +24.83% |
Spot volume (24h) | $4.24B | n/a |
Open interest | $53.35B | -2.83% |
Options volume | $4.25B | +27.77% |
Options open interest | $39.66B | +1.06% |
Liquidations hit $94.58 million in 24 hours. Longs took most of the loss.
Window | Total | Longs | Shorts |
1 hour | $77.63K | $76.67K | $958.07 |
4 hours | $39.05M | $38.67M | $377.66K |
12 hours | $58.94M | $42.46M | $16.48M |
24 hours | $94.58M | $52.06M | $42.52M |
BTC Stuck in Falling Channel Below Key Averages
The daily chart shows price inside a falling channel. It sits below the 20-day and 50-day EMAs. Today's candle opened at $81,250 and sits near $79,744, down 1.85%.
BTC ran from the low $60,000s in mid-August to a high near $87,404 in late September. It has made lower highs since.
Our Bitcoin price prediction stays cautious to bearish while price holds inside this channel. That is a view, not a promise.
Level | What It Is |
$87,404 | Recent high |
$84,000 to $85,000 | Channel resistance |
$83,000 to $85,000 | Recovery zone if buyers step in |
$81,516 | 20-day EMA |
$80,717 | 50-day EMA |
$78,000 to $77,800 | Near support, 100-day EMA at $77,802 |
$76,427 | 200-day EMA |
$74,000 to $72,000 | Deeper support zone |
A drop under $77,800 could open the way to $76,400, then $74,000 to $72,000. If buyers win back $80,700 to $81,500, a move toward $83,000 to $85,000 is possible.
The setup leans cautious to bearish while BTC stays in the channel. A clean break above $84,000 to $85,000 would help the bulls.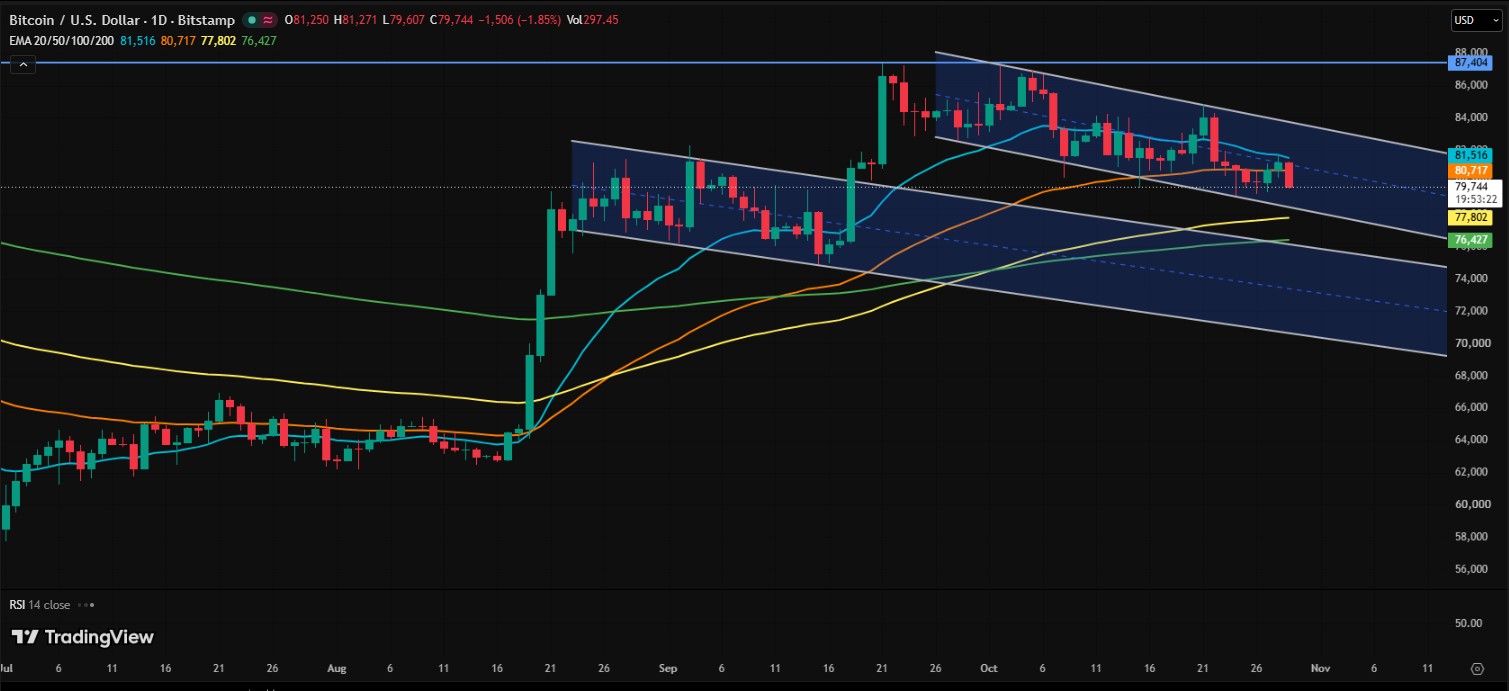
Where Could BTC Go Next? Three Paths to Watch
The setup leans cautious to bearish while BTC stays inside the channel. This is not a sure call. Markets can turn fast.
Scenario | What Needs to Happen | Levels in Play |
Bullish | Buyers win back $80,700 to $81,500 | $83,000 to $85,000 |
Neutral | Price chops between the averages | $77,800 to $81,500 |
Bearish | Daily close below $78,000 to $77,800 | $76,400, then $74,000 to $72,000 |
A clean break above $84,000 to $85,000 would strengthen the bull case. A slip under $77,800 could open the way to $76,400 first.
September PCE Data Could Reset Fed Bets
September PCE inflation data is due today. It may change how traders see the December Fed meeting.
A hotter reading could strengthen hike bets. A softer one could ease them. Nobody knows which way it goes, and the market can react in odd ways.
Disclaimer
This article is for information only. It is not financial, investment, or trading advice. Crypto is volatile, and you can lose money. Prices and probabilities can change fast. Do your own research and speak with a licensed financial advisor before you invest.
0
0

 Manage all your crypto, NFT and DeFi from one place
Securely connect the portfolio you’re using to start.
 Where will Bitcoin trade next?
Live Polymarket and Kalshi odds on Bitcoin price targets, compared side by side.
See Bitcoin price odds


