
Crypto Fear and Greed Index at 28: What Happened Every Time the Market Hit Extreme Fear

0
0

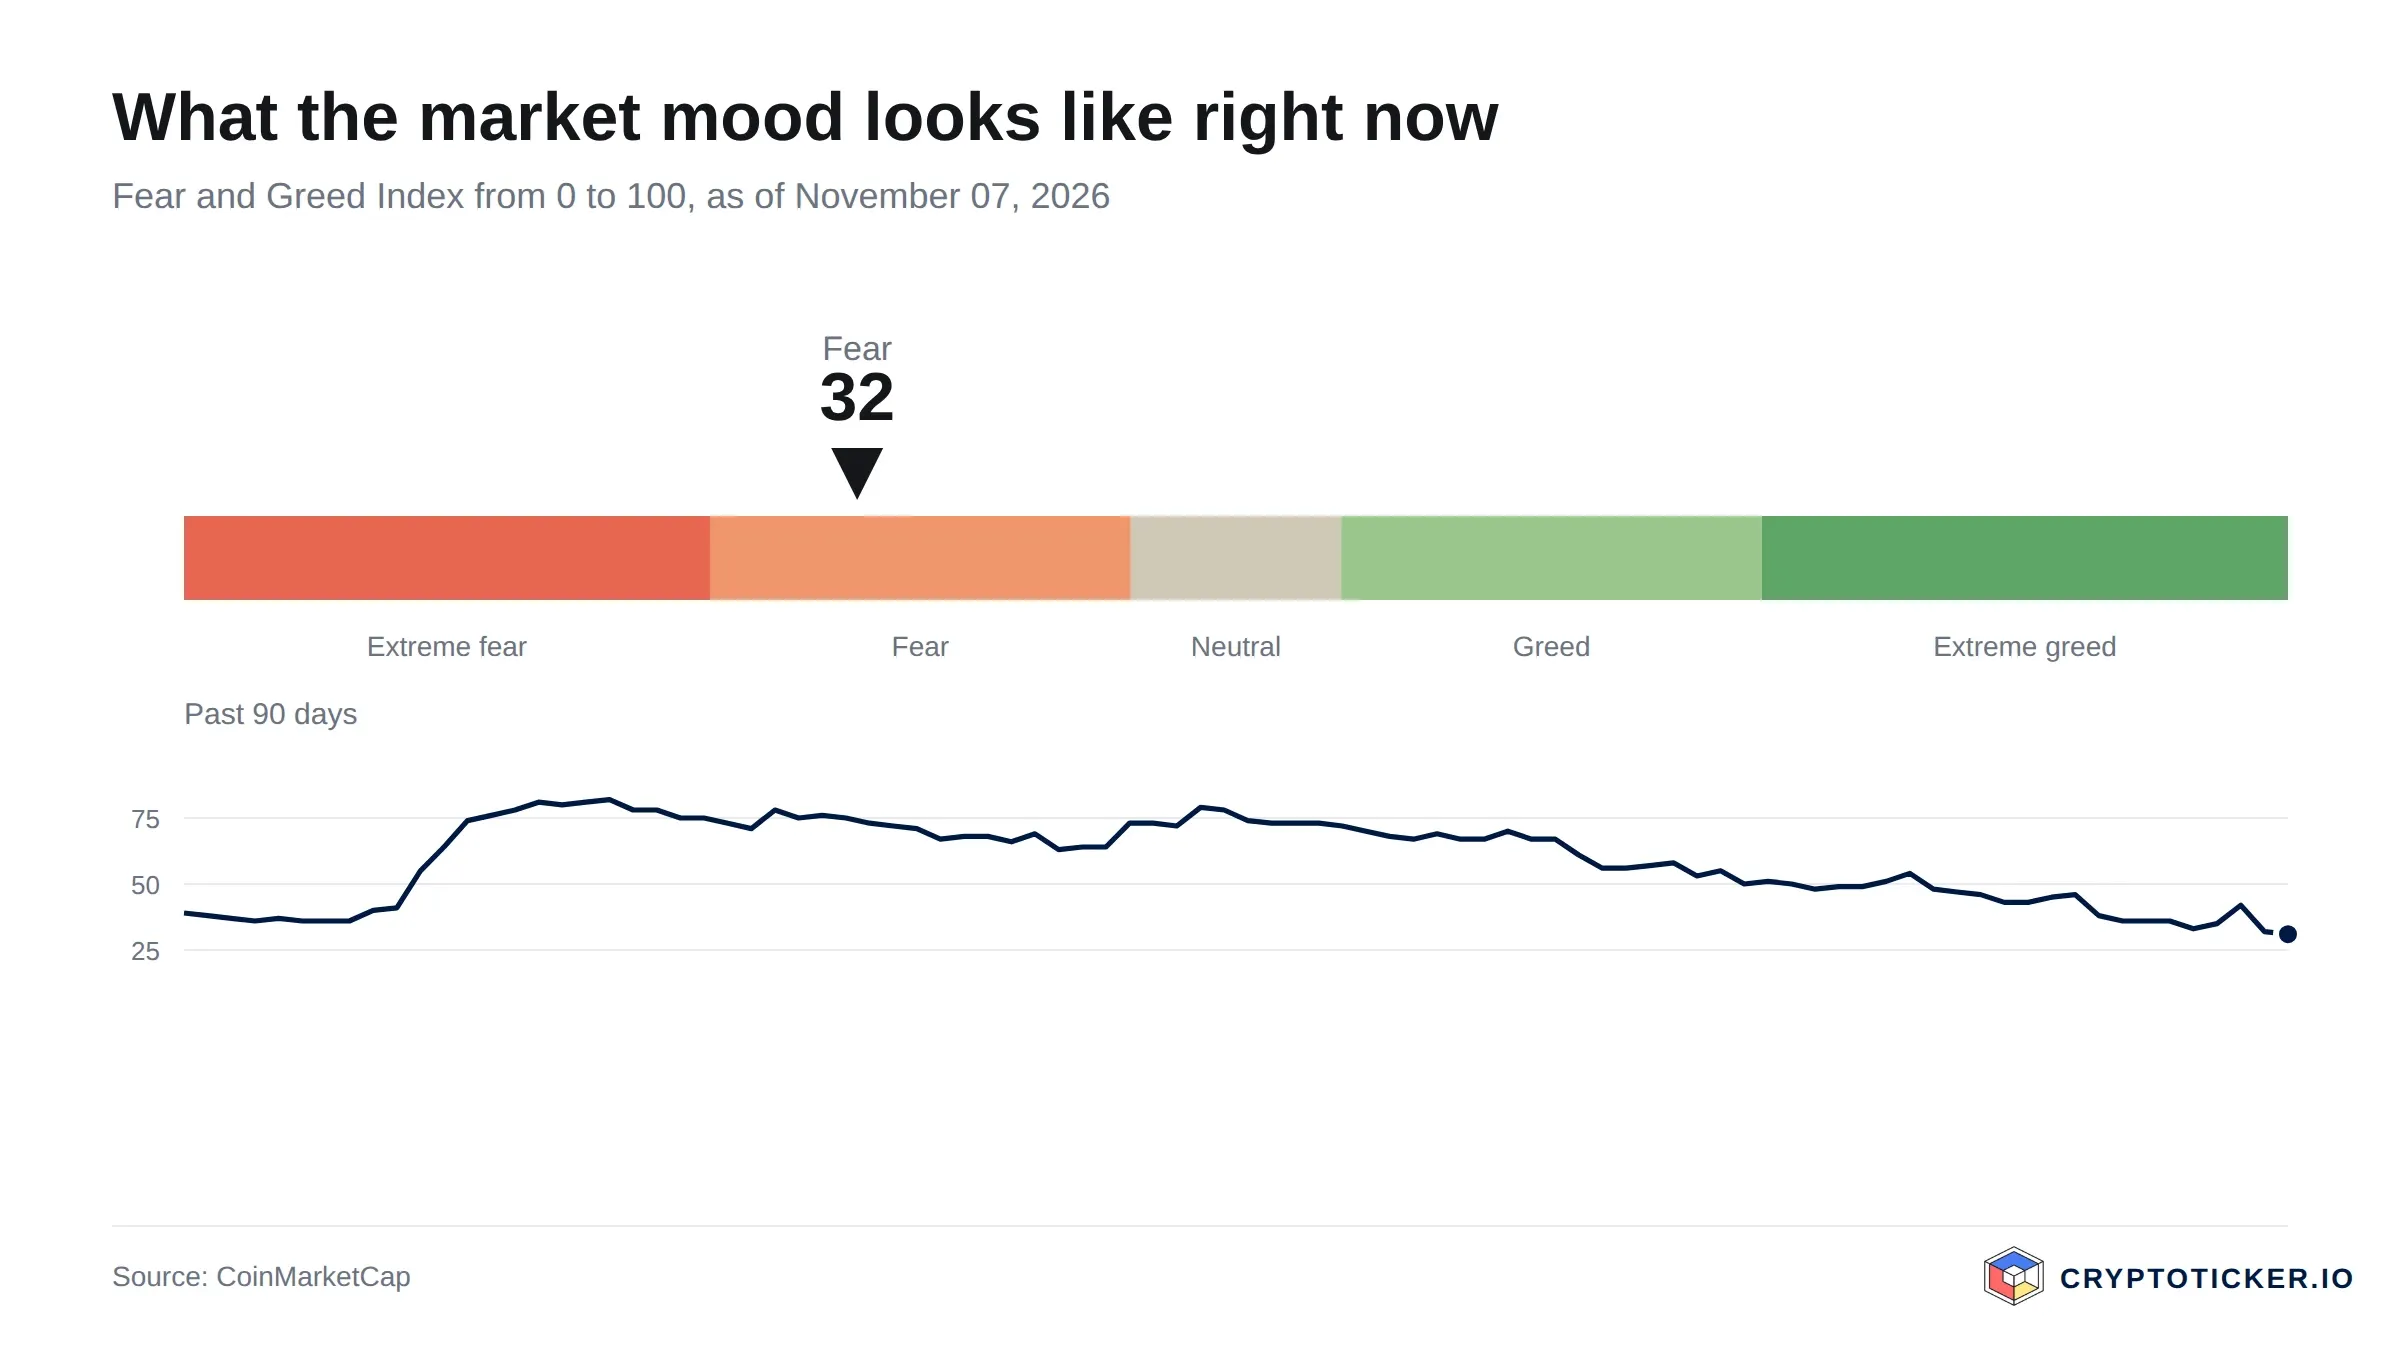
Sentiment has caught up with price. After Friday's sell-off the Crypto Fear and Greed Index sits at 28, in the fear zone, a few points above the "extreme fear" line at 24. It has been there twice already this year, and both times the readings were among the lowest ever recorded. So what happens when crypto gets this scared? We went through every episode.
What does the Fear and Greed Index actually measure?
The index compresses volatility, trading volume, social media activity, Bitcoin dominance and Google search trends into a single score from 0 to 100. Below 25 is extreme fear, 25 to 49 is fear, 50 to 74 is greed and 75 and up is extreme greed. It is a mood ring, not a forecast: it tells you how the crowd feels today, not what price does tomorrow. Its value lies in the pattern that tends to follow the extremes.
What happened after each extreme fear episode?
- March 2020, index 8. The COVID crash took Bitcoin from 9,000 to around 3,800 dollars in a week. The index stayed in single digits for days. Two months later Bitcoin was back at 9,000; a year later it was above 50,000.
- June 2022, index 6 to 8. The Terra collapse and the Celsius freeze pushed Bitcoin to around 18,000 dollars. This is the counterexample: BTC spent months stuck between 19,000 and 22,000 and the index barely left fear territory all summer. Buying the first extreme fear print did not pay for half a year.
- November 2022, index 8 to 15. FTX's bankruptcy marked Bitcoin's cycle low at 15,649 dollars. Within two months Bitcoin was one of the best-performing assets of early 2023, and the index never revisited those lows.
- August 2024, index 17. The yen carry-trade unwind sent Bitcoin to about 49,000 dollars. Three months later it was above 90,000.
- March 2025, index 10. Tariff fears pushed Bitcoin toward 77,000 dollars and kept the index in extreme fear for weeks. By May, Bitcoin was back above 100,000.
- February 2026, index 9. Bitcoin crashed below 61,000 dollars in a reading last seen after FTX. The rebound came, though not overnight.
- June 2026, index 5 to 8. The lowest reading in the index's history, after Strategy's first ever Bitcoin sale rattled the market. The recovery that followed took the index back above 70 by October.
What is the pattern?
Three things hold across the data. First, buying extreme fear has beaten buying greed over a six to twelve month horizon in every single case. Second, the bottom is almost never the first extreme fear reading; the index usually stays depressed for weeks, and 2022 shows it can stay there for months. Third, the shift from extreme fear back to ordinary fear has often been the point where the worst was over, which is why a reading of 28 today is less interesting than whether the index drops below 25 next week.
Is a reading of 28 a buy signal right now?
On its own, no. Fear at 28 is uncomfortable but ordinary; the market has been here dozens of times without marking a bottom. What would make it interesting is a drop into the low 20s combined with the kind of forced selling we saw on Friday, when over a billion dollars in leveraged positions were wiped out. That combination, panic plus liquidation, is what preceded the strongest rebounds in the list above. Until then, the honest read is: sentiment is washed out, not capitulated.
Watch the index daily on the CryptoTicker charts page, alongside liquidations and Bitcoin dominance, and check live prices on the CryptoTicker crypto prices page. This is not financial advice.
0
0

 Manage all your crypto, NFT and DeFi from one place
Securely connect the portfolio you’re using to start.
 Where will Bitcoin trade next?
Live Polymarket and Kalshi odds on Bitcoin price targets, compared side by side.
See Bitcoin price odds


