
Fear and Greed Hits 10. Across 26 Earlier Prints, Bitcoin’s 90-Day Median Gain Is 1.4%

0
0

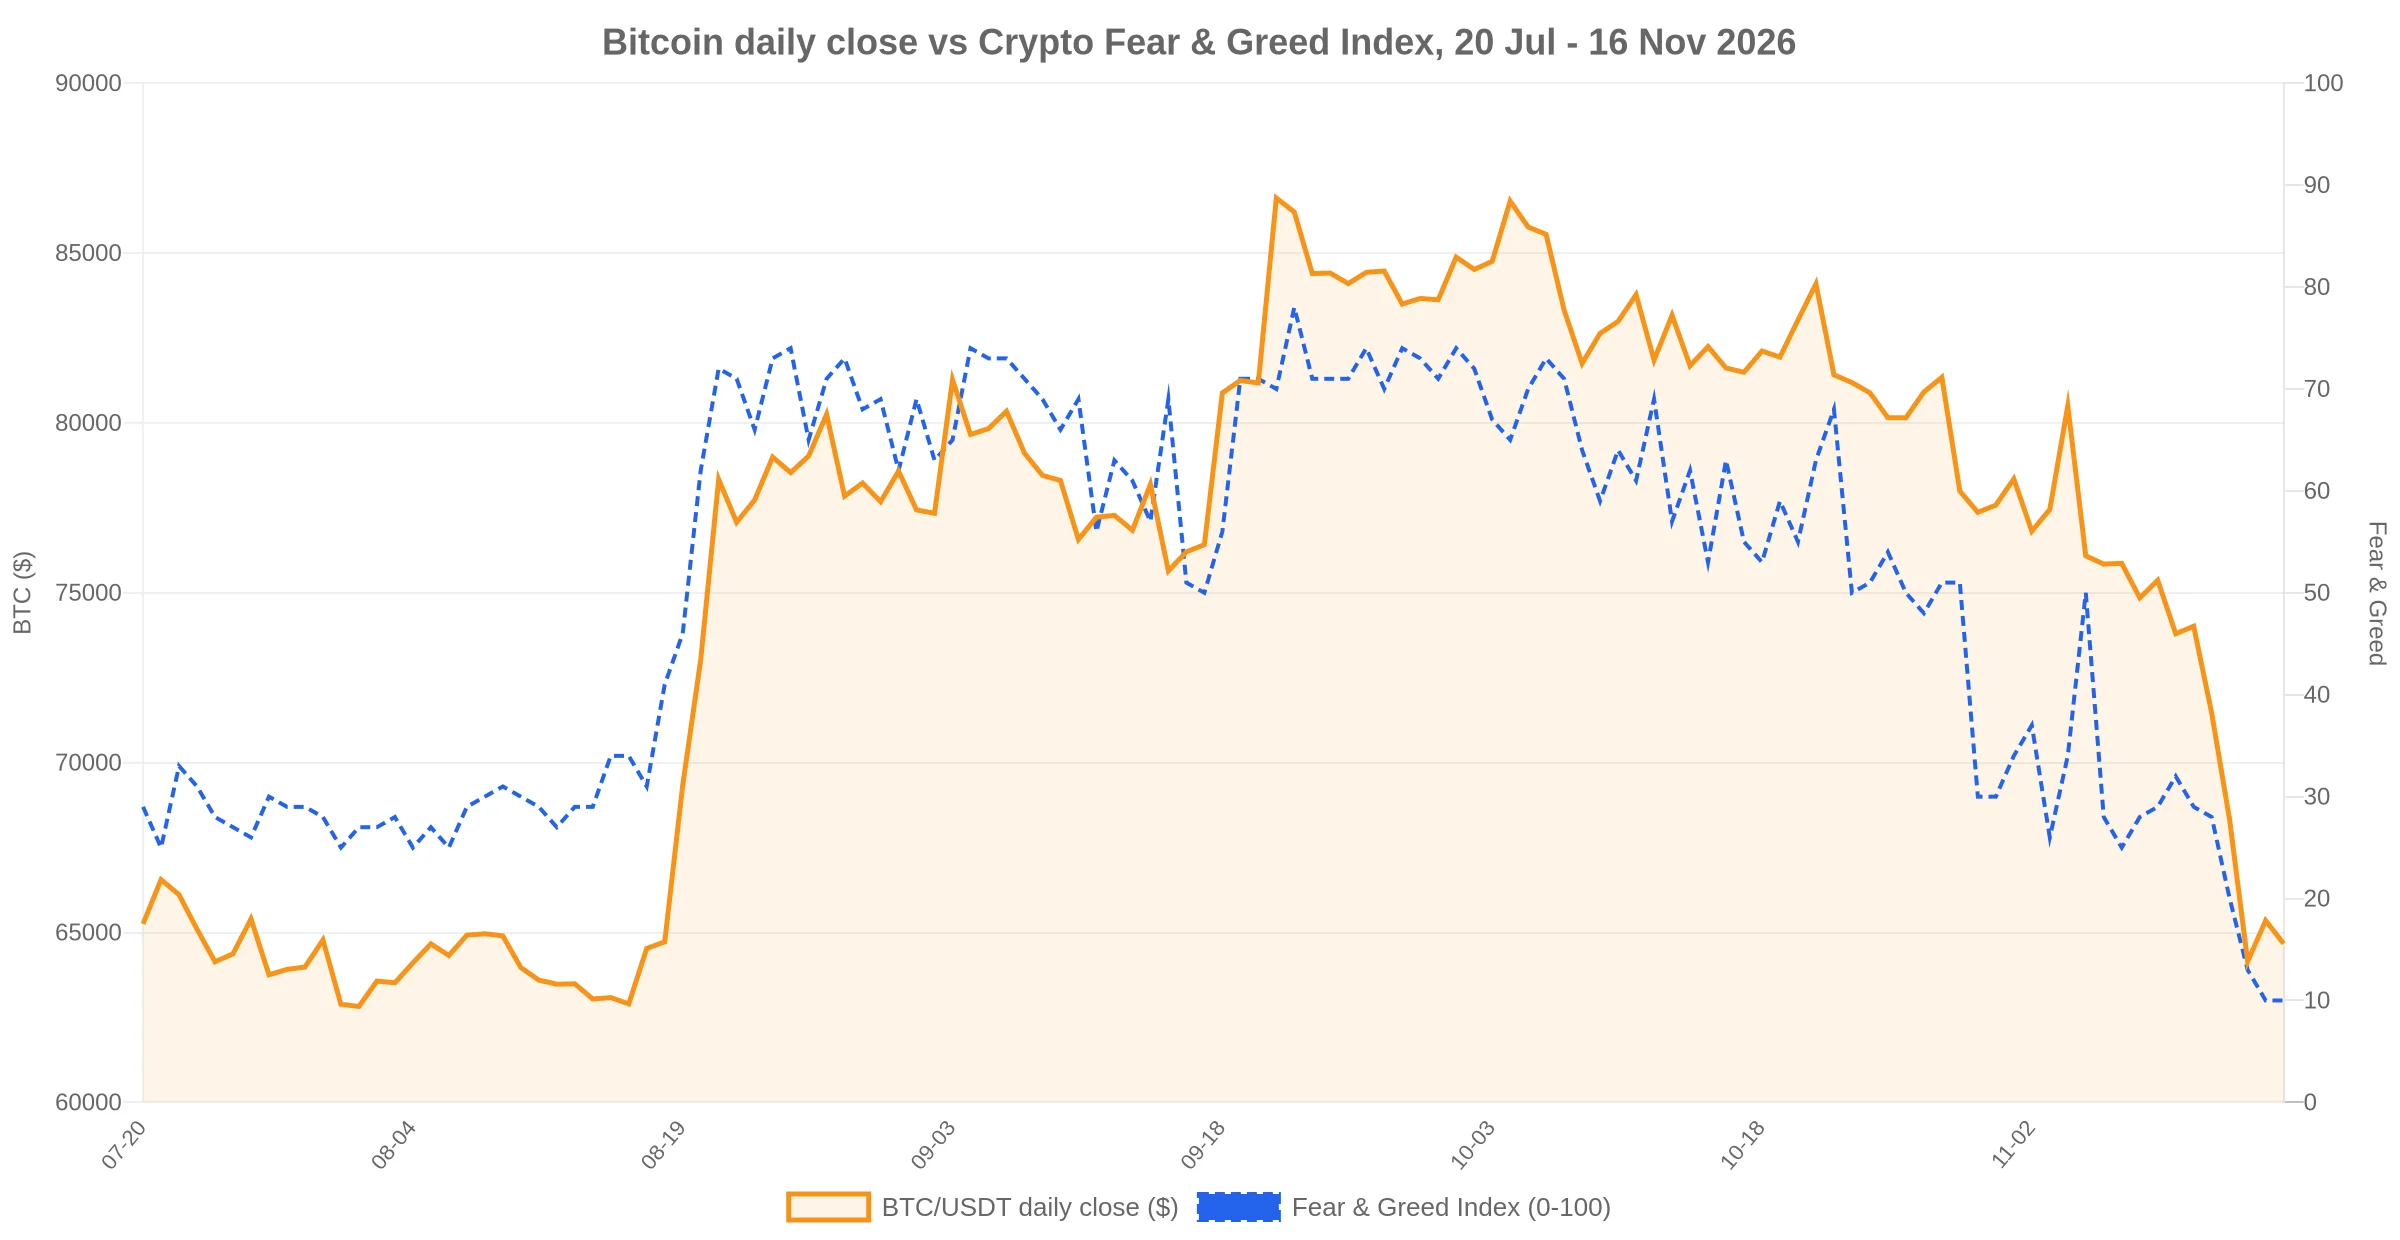
Two consecutive sessions at 10 have returned the crypto Fear and Greed Index to the band its publisher labels Extreme Fear, the first readings that low since 8 to 10 June. Bitcoin traded at $64,780 shortly before 05:00 UTC on 16 November, 48.6% below the $126,080 record set in October 2025 and 13.5% lower than a week earlier, according to CoinGecko. Ether changed hands at $1,816.85, down 14.8% on the week and 63.3% below its own record.
The question that matters for anyone treating sentiment as an input is narrower than whether fear is high. It is whether a floor-level reading has carried information about the following 90 days. Matching the daily index against BTC/USDT daily closes gives 71 sessions at or below 10 since February 2018, grouped into 26 separate clusters. Across the 25 clusters old enough to measure, the median 90-day move was a gain of 1.4%. Fourteen ended higher. The outcomes ran from a 38.4% loss to a 100.0% gain.
That distribution is the whole finding, and it is thinner than the phrase extreme fear suggests. A coin-flip hit rate with a 138-point spread is not a timing signal. It is a description of how differently the same sentiment reading resolved in 2020, in 2022 and in February this year.
What the Index Measured on Monday
The index is a composite scored from 0 to 100. Its publisher lists five inputs, with volatility weighted at 25% and market momentum and volume at a further 25%. Social media contributes 15%. The weighting matters because two of the largest components are functions of recent price behaviour rather than of what holders say or do.
The methodology is direct about that link: “We’re measuring the current volatility and max. drawdowns of bitcoin and compare it with the corresponding average values of the last 30 days and 90 days. We argue that an unusual rise in volatility is a sign of a fearful market.” It adds: “We are gathering data from the five following sources. Each data point is valued the same as the day before in order to visualize a meaningful progress in sentiment change of the crypto market.”
The publisher also states that the index covers bitcoin alone, which is worth remembering in a market where solana trades 75.6% below its record and ether 63.3% below its. Its stated interpretation of the bottom of the scale is unhedged: “Extreme fear can be a sign that investors are too worried. That could be a buying opportunity.” How the composite is built, and what each band has historically meant, is set out in BlockchainReporter’s guide to the Fear and Greed Index.
Monday’s reading follows 13 on 14 November, 20 on 13 November and 28 on 12 November. The publisher’s own comparison panel shows Extreme Fear at 10 now, Fear at 29 a week ago and Greed at 55 a month ago. The fall from 68 on 22 October is 58 points in 25 days.
The 26 Clusters Since February 2018
A cluster here is a run of sessions at or below 10 separated by no more than three days, which keeps a single episode from being counted repeatedly. The 71 qualifying sessions amount to 2.2% of the 3,207 days the public series covers. They are unevenly spread: the four largest clusters account for 38 of the 71 sessions, and 2022 alone holds seven of the 26 clusters.
| Cluster begins | Lowest print | Sessions at or below 10 | Bitcoin 90 days after the last session |
|---|---|---|---|
| 6 Feb 2018 | 8 | 1 | +22.4% |
| 25 Nov 2018 | 9 | 1 | +0.8% |
| 14 Dec 2018 | 10 | 1 | +20.3% |
| 22 Aug 2019 | 5 | 1 | -19.8% |
| 13 Mar 2020 | 8 | 7 | +43.7% |
| 28 Mar 2020 | 8 | 2 | +42.6% |
| 12 Apr 2020 | 10 | 1 | +33.8% |
| 24 May 2021 | 10 | 1 | +26.9% |
| 30 May 2021 | 10 | 1 | +37.2% |
| 22 Jun 2021 | 10 | 1 | +32.3% |
| 21 Jul 2021 | 10 | 1 | +100.0% |
| 8 Jan 2022 | 10 | 1 | +1.4% |
| 10 May 2022 | 8 | 5 | -20.9% |
| 23 May 2022 | 10 | 1 | -26.1% |
| 30 May 2022 | 10 | 1 | -38.4% |
| 3 Jun 2022 | 10 | 2 | -33.7% |
| 14 Jun 2022 | 6 | 8 | -5.7% |
| 28 Jun 2022 | 10 | 1 | -5.2% |
| 27 Feb 2025 | 10 | 1 | +27.2% |
| 15 Nov 2025 | 10 | 2 | -25.9% |
| 6 Feb 2026 | 5 | 16 | +20.7% |
| 2 Mar 2026 | 10 | 2 | -8.1% |
| 9 Mar 2026 | 8 | 1 | -7.5% |
| 22 Mar 2026 | 8 | 7 | -8.1% |
| 8 Jun 2026 | 8 | 3 | +27.5% |
| 15 Nov 2026 | 10 | 2 | open |
The column that matters is the last one. Clusters that resolved well, such as 21 July 2021 and 13 March 2020, came after drawdowns that had already run for months. Clusters that resolved badly, such as 30 May 2022, looked identical on the day they printed. The index recorded the same 10 in both cases.
Five Sessions, $1.07 Billion, and IBIT’s 85% Share
The flow record is the second piece of evidence, and it is more current than the index. Farside Investors’ daily table for the US spot bitcoin funds shows five consecutive negative sessions from 9 to 13 November: $201.0 million out, then $95.0 million, $299.8 million, $284.1 million and $185.4 million. The five sessions removed $1,065.3 million in total.
BlackRock’s IBIT carried $908.4 million of that, or 85.3% of the five-session total. Fidelity’s FBTC accounted for $111.3 million, Grayscale’s GBTC for $39.1 million. Morgan Stanley’s MSBT was the only fund to take in money across the period, adding $54.4 million. IBIT has now absorbed $64,193 million of net inflow since the funds launched in January 2024, more than the industry total of $54,701 million, because GBTC has bled $28,149 million over the same span.
Set against that cumulative figure, the five-session outflow is 1.95% of all net money the category has taken in. It is a reversal in direction and a modest one in scale. The prior five-session window, 2 to 6 November, removed $1,281.7 million by the same table, the stretch BlockchainReporter covered when it reported that the funds had shed $1.28 billion. The latest week was smaller, not larger, and the heaviest single session this month remains 11 November at $299.8 million.
Two limits apply to the flow data. The table ends on Friday 13 November because the funds do not create or redeem over the weekend, so Monday’s session is the next observation. And a fund redemption is not the same as a long-term holder selling coins; it records an authorised participant unwinding shares, which the issuer then settles in bitcoin.
2022: Seven Clusters and a 51% Slide
Seven of the 26 clusters fall in 2022, and they explain why the median is a weaker statistic than the dispersion. The first, on 8 January 2022, arrived with bitcoin at $41,680 and 38.3% below its then-record close. From that session to 28 June 2022, bitcoin fell to $20,281, another 51.3%.
Four clusters printed inside that slide: 10 to 17 May, 23 May, 30 May and 3 to 5 June. The 90-day outcomes measured from their final sessions were losses of 20.9%, 26.1%, 33.7% and 38.4%. Someone who bought the first print of the year at $41,680 was 51.3% underwater by 28 June.
What separates those clusters from a bottom is that the drawdown kept deepening between them, from 55% to 70% below the record. The index does not distinguish the first print of a decline from the seventh, and in 2022 it printed at or below 10 in four different months of the same decline.
February 2026 Is the Closer Analogue
On a close basis the nearest historical match to Monday’s position is February this year, not 2022. Between 6 and 24 February the index sat at or below 10 for 16 sessions and printed as low as 5, while bitcoin traded 48.6% below its record close. Monday’s comparable figure is 48.1%, a half-point apart. The 7, 30 and 90-day outcomes from the last session of that cluster were gains of 6.7%, 7.4% and 20.7%.
One analogue is not a base rate. The February cluster is also recent enough that its recovery may be part of what the current decline is reversing against, which makes it evidence of variety rather than evidence of support.
The 2025 comparison cuts the other way and is closer in calendar terms. On 15 and 16 November last year the index also printed 10, with bitcoin at $94,261 and only 24.4% below its record. Ninety days later bitcoin closed near $69,850. Extreme fear that weekend preceded a further decline of 25.9%.
Where the Record Stops Being Useful
Four constraints limit what the 26 clusters can establish.
The clusters are not independent observations. Seven share 2022, three share 2026, and several sit inside the same multi-month decline. Treating them as 26 separate trials overstates the sample.
The index is partly a volatility gauge, so it will read extreme fear in any fast decline, including one that continues for weeks. A reading of 10 is closer to a description of the last 30 days than a forecast of the next 90.
The drawdown comparisons use daily closes. On CoinGecko’s intraday record of $126,080, Monday’s discount is 48.6% rather than the 48.1% used in the cluster table, and the February comparison is unaffected by that choice but other clusters are not.
The public series starts in February 2018 and spans two cycles. Twenty-six clusters cannot separate the effect of sentiment from the macro conditions that produced the sentiment, and the index’s own inputs have been revised since launch, including sentiment sources that were not live in the earliest years.
Three Readings That Would Change the Signal
The first is a positive session in the Farside table. Every session since 9 November has been negative, and a single green day would break the streak without proving a turn; the 11 November print of $299.8 million out is the reference point for how large a reversal would need to be to matter.
The second is the index leaving the Extreme Fear band. The publisher currently records 29 for a week ago, so a return to the high twenties would end the present cluster without requiring a new price high.
The third is price structure. Bitcoin’s last close was $64,694 against a 200-day simple average of $72,920, 11.3% below it, and a 50-day average of $79,448. A close below $64,150, the 14 November low, would put the market at a new low for the month. A close below $58,625, the 30 June low, would be the lowest close of 2026. Both levels are daily closes on Binance BTC/USDT, and both are invalidation points for the reading that February’s analogue is the relevant one.
None of those three observations is a forecast. They are the readings that would tell an allocator whether the current cluster is behaving like February 2026 or like May 2022, and the 26-cluster record says the two were indistinguishable at the moment the index printed 10.
Data: alternative.me, Farside Investors, CoinGecko, Binance. Prices and index values are as of 16 November 2026, 05:00 UTC.
This article is not intended as financial advice. Educational and informational purposes only. Index readings and flow data are historical records and do not predict future prices.
0
0

 Manage all your crypto, NFT and DeFi from one place
Securely connect the portfolio you’re using to start.
 Where will Bitcoin trade next?
Live Polymarket and Kalshi odds on Bitcoin price targets, compared side by side.
See Bitcoin price odds


