
Bitcoin may be Gearing for a Massive Comeback Next Week as Sellers Show First Sign of Exhuastion

0
0

Bitcoin is heading for a bearish close this week. Currently down almost 3%, the asset could record its second consecutive weekly decline if market conditions remain unchanged.
The recent downtrend has left traders bracing for further losses, with a growing number of bearish predictions adding to concerns. A closer look at these forecasts reveals a common expectation: some analysts believe a drop below $80,000 is increasingly likely.
A previous Bitcoin outlook also supports this bearish view. It noted that BTC was approaching a bearish MACD crossover and suggested that a confirmed signal could push the asset below $80,000. Although the analysis highlighted other factors, the MACD reading offers a useful indicator to monitor.
The bearish crossover has since occurred, and BTC reached $79,000 on Thursday. The next question is whether this decline marks the beginning of the deeper correction many analysts anticipated. In other words, they expect further losses in the coming week. The earlier outlook also identified $74,000 as a potential downside target.
Interestingly, the analysis included a caveat: price action during the second half of October remains uncertain.
Several events also coincided with Bitcoin’s decline this week. One was Wednesday’s CPI report, which showed that inflation remained above expectations. Both headline and core inflation exceeded forecasts. Core CPI rose 2.6% year over year and 0.3% month over month, slightly above expectations of 2.5% and 0.2%, respectively.
These figures revived inflation concerns and added pressure to risk assets. Thursday’s PPI report further contributed to the uncertainty, with producer price data also raising concerns about persistent inflation.
Taken together, macroeconomic developments contributed to the bearish sentiment surrounding Bitcoin this week. Looking ahead, weekly jobless claims will be one economic release to watch. A relatively quieter economic calendar may leave more room for technical factors and investor positioning to shape BTC’s next move, provided no fresh macroeconomic shocks emerge.
Is a Recovery Possible Next Week?
While macroeconomic developments have contributed to the recent decline, other factors suggest that Bitcoin could be approaching a local bottom. One of these is on-chain data.
A recent analysis from Glassnode presents a reason to expect a potential recovery in the coming week. Examining Thursday’s decline, the analysis indicated that sellers were increasingly realizing losses. The likelihood of continued selling from this group may diminish if the current conditions persist. This possibility is further supported by a slowdown in profit-taking.
This data is worth monitoring because similar patterns have preceded several local bottoms. For example, local lows in early August, mid-August, and mid-September followed bursts of loss realization, resembling the activity observed during the recent intraday sell-off.
If history repeats itself, Bitcoin could experience a recovery next week.
Interestingly, previous price movements offer another reason to consider this possibility. Identifying a recurring pattern, Killa pointed out that the 14th of several months had marked a turning point for Bitcoin. According to this observation, BTC tended to reverse direction after that date when it had been trending downward beforehand.

The accompanying chart illustrates this pattern. Given that Bitcoin has experienced significant selling pressure over the past two weeks, a reversal within the next seven days is possible. However, a limited number of historical examples cannot establish a reliable trading signal, so this observation should be treated as supplementary evidence rather than confirmation of a recovery.
Meanwhile, buyers appear to be taking advantage of potential seller exhaustion. During the previous intraday session, BTC staged a notable rebound from its low and ended the day with modest gains.
In summary, slowing profit-taking, on-chain signals, and historical price patterns suggest that a turnaround could begin next week. However, the recovery remains uncertain, and Bitcoin’s technical structure still presents reasons for caution.
Bitcoin Is Not Out of the Woods Yet
Although several indicators point to a potential recovery, the charts reveal reasons to remain cautious.
Before examining the individual timeframes, it is worth highlighting an important development from Thursday. Following its retracement to $79,700, Bitcoin’s demand concentration shifted. Previously, $80,000 had attracted the greatest concentration of demand.
Glassnode’s analysis indicated that attention had shifted from this support level toward the previous day’s low. Although the price difference is relatively small, weakening demand around $80,000 could have significant consequences for Bitcoin if selling pressure intensifies.
The daily chart helps explain the potential implications. BTC has traded above $81,000 for most of the past seven days, despite occasional dips below the level. Buyers have generally defended this area, preventing a sustained close beneath it.
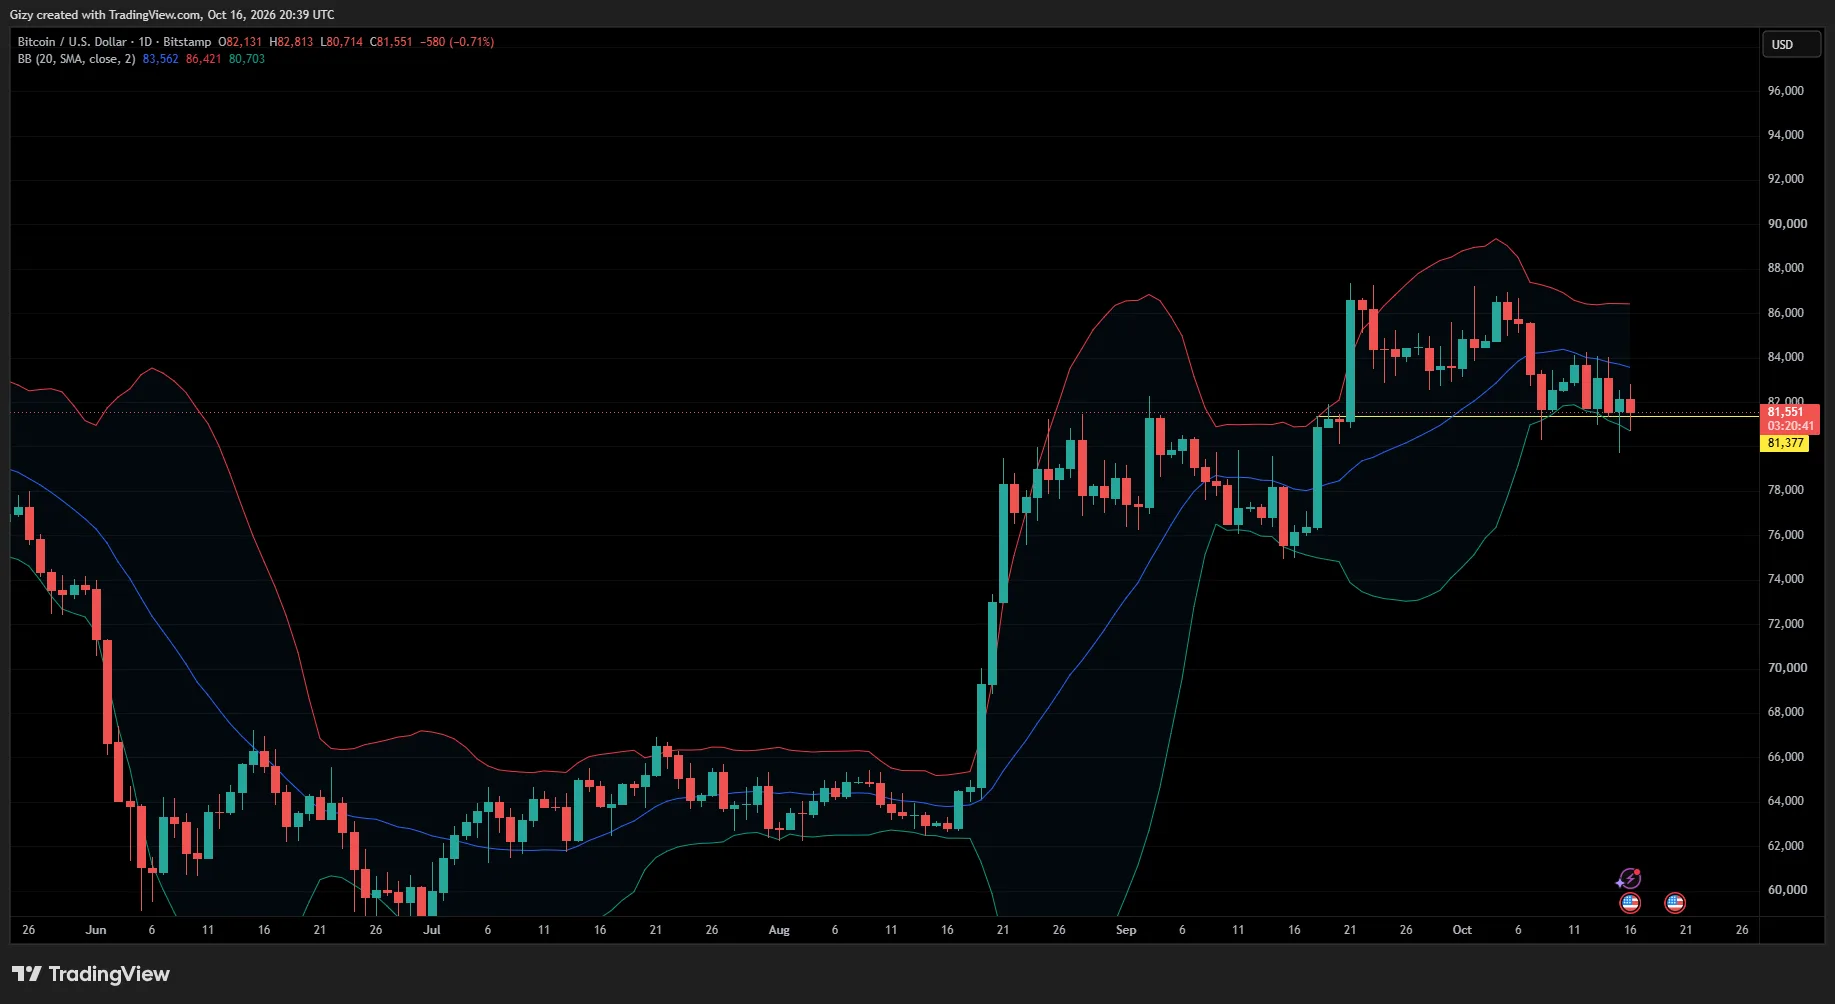
However, a daily close below $81,000, followed by continued trading beneath the level, could expose Bitcoin to a new trading range between $80,000 and $75,000. The weakening of demand around $80,000 increases the risk of such a move, although it does not guarantee that the asset will enter this range.
Despite these concerns, the Bollinger Bands offer a potential signal for recovery. The daily chart shows that Bitcoin has traded close to the lower band for much of the week. Such price action can indicate sustained selling pressure and, in some cases, precede a rebound. However, proximity to the lower band alone does not confirm that a reversal is imminent.
On the weekly chart, Bitcoin also created a fair-value gap after rebounding from around $80,000 and closing near $83,600 the previous week. The recent decline has filled this gap, potentially removing one technical obstacle to a recovery. Nevertheless, filling a fair-value gap does not guarantee that prices will move higher.
Ultimately, the next seven days could prove critical for Bitcoin. A sustained daily close below $81,000 would weaken the recovery outlook and expose the $80,000–$75,000 range, with $74,000 emerging as a possible downside target if selling accelerates.
Conversely, if buyers defend support and BTC reclaims the lost levels, the recent decline could prove to be a local bottom rather than the beginning of a deeper correction. For now, neither outcome is confirmed, and Bitcoin’s next move will likely depend on whether buyers can defend support or sellers regain control.
The post Bitcoin may be Gearing for a Massive Comeback Next Week as Sellers Show First Sign of Exhuastion appeared first on CoinTab News.
0
0


 Manage all your crypto, NFT and DeFi from one place
Securely connect the portfolio you’re using to start.
 Where will Bitcoin trade next?
Live Polymarket and Kalshi odds on Bitcoin price targets, compared side by side.
See Bitcoin price odds


