
SUI Price Prediction November 2026: Can $0.8350 Support Hold?

0
0

Will buyers defend the $0.8350 level before the daily candle slips toward $0.6832? The week hinges on that answer.
This SUI price prediction November 2026 leans cautious. $SUI trades at $0.8975, between the $0.8350 support and the 50 EMA level. See the earlier SUI hack recovery analysis.
SUI Market Snapshot for the November Outlook
CoinGecko market data, captured at 05:25 UTC on Nov 2, 2026, ranks $SUI at 30. That's a top 30 coin by market cap.
Metric | Value |
Price | $0.8989 |
24h change | -0.28% |
24h range | $0.8870 to $0.9084 |
Market cap | $3.714B |
FDV | $8.973B |
24h trading volume | $221.653M |
Perps open interest | $885.914M |
Circulating supply | 4.139B SUI |
Source: CoinGecko market data, captured at 05:25 UTC on Nov 2, 2026.
FDV is the token value if all 10B tokens were circulating. At $8.973B, FDV is 2.4 times market cap.
SUI Price Forecast: Week and Month Performance
Over the last 24h, $SUI traded between $0.8870 and $0.9084, per CoinGecko market data. The band was $0.0214 wide.
Price sits 1.2% above the low and 1.2% below the high. That's a narrow 2.4% day.
The performance panel shows a 7-day change of -2.14%. That implies a week-ago price at $0.9172, about $0.02 higher.
Over 30 days, the drop is 21.57%. That implies about $1.1443 a month ago.
But the 90-day gain of 30.40% shows the September rally hasn't fully unwound. Year to date, $SUI is down 35.83%.
SUI Liquidation Data Shows Longs Hit First
Longs took the damage. A liquidation is a forced exit of a margin trade once collateral runs out.
CoinGlass liquidation data shows $332.57K wiped out over 24h. Longs lost $237.73K, or 71.5%. Shorts lost $94.84K.
Over the last 12h, the tally hit $269.96K. That's 81% of the day's total. The last 1h added $11.12K, all longs.
A flat $0 for shorts in the last 1h. Only long ones were forced out.
That sounds like a flush. But the 1-hour reading is only $11.12K, so the pressure has faded.
SUI Price Prediction November 2026: Open Interest Data
Open interest is the total value of futures contracts still open. CoinGecko lists open interest on perpetual futures at $885.914M, captured at 05:25 UTC on Nov 2, 2026.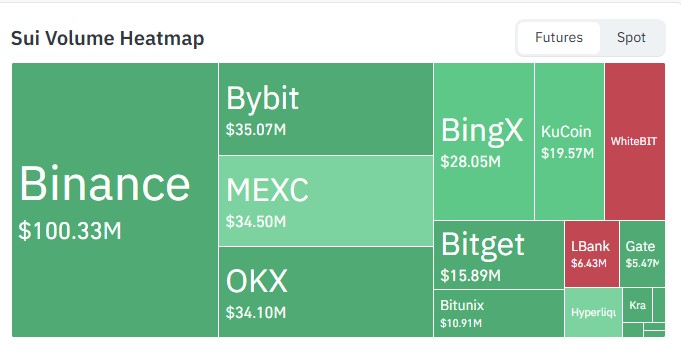
Source: CoinGlass volume heatmap, captured at 05:25 UTC on Nov 2, 2026.
The futures volume heatmap ranks Binance first at $100.33M. Bybit is second at $35.07M, a gap of $65.26M.
MEXC (34.50M) and OKX (34.10M) trails Bybit by under $1M. Binance holds 34.6% of the $290.32M across the ten exchanges with visible figures. So the Binance chart carries the most volume.
SUI Token Release and Period Catalysts
A cliff release frees a block of locked tokens at once. DefiLlama vesting schedule data lists two on Nov 1, 2026, at 05:48 UTC.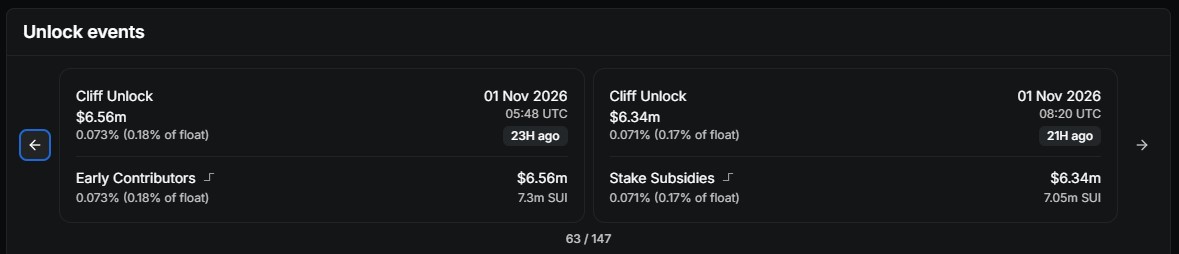
Source: DefiLlama, captured at 05:25 UTC on Nov 2, 2026.
Early Contributors released $6.56M at 05:48 UTC. Stake Subsidies followed with $6.34M at 08:20 UTC.
Together, the two events total $12.90M, or 0.35% of circulating supply. The 24h change is only -0.6%, so the market absorbed the supply.
Conditions matter instead. Buyers need the daily candle above $0.9602, and sellers need $0.8350 to break.
SUI Technical Analysis: 1-Day Timeframe
The $SUI price prediction November 2026 chart is the Binance SUI/USDT daily from TradingView, captured at 05:25 UTC on Nov 2, 2026. It opens with a base.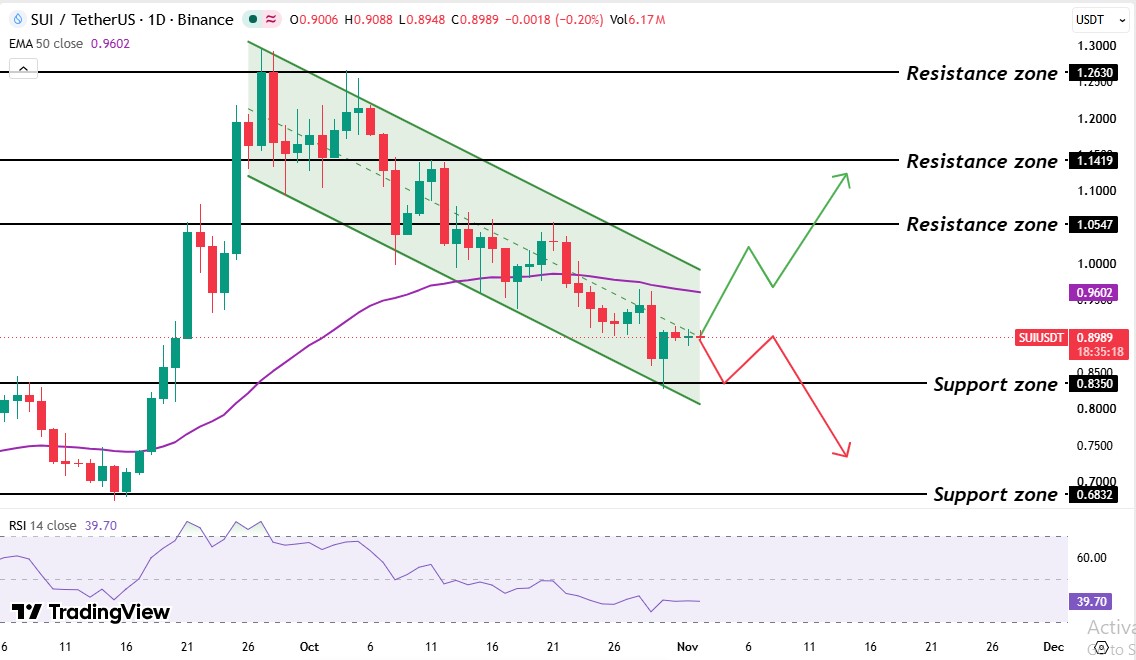
Source: TradingView, SUI/USDT 1D, captured at 05:25 UTC on Nov 2, 2026.
On 6th September the price came down from the $0.8350 level and tested the support $0.6832 level.
In mid-September, after taking support, the price did breakout. The price broke out above the $1.2630 level, but sellers defended the $1.2630 level.
After that price did some range trading between the $1.1419 and $1.2630 levels.
After this price started moving in a downtrend, by making lower highs and lower lows, it formed a descending channel.
Late October brought a breakout attempt toward the EMA at $0.96. It failed. A long red candle followed, and the price tested the lower trendline support at the $0.8350 level.
Price now hovers at the midline of the channel.
The 50-day EMA at $0.9602 and the price have traded below it since mid-October. Right now buyers need to break the 50 EMA in order to gain control.
RSI, reads 39.70. Readings under 50 mean sellers lead. Under 30 would signal oversold, so the downside room remains.
A related piece covers how Brazil exchange access could lift $SUI. That case needs a price above the 50-day EMA.
SUI Support Levels and Resistance Levels
Level | Role |
$1.2630 | Range top |
$1.1419 | Resistance |
$1.0547 | Resistance |
$0.9602 | 50-day EMA |
$0.8350 | Support |
$0.6832 | Support |
Support and resistance are zones where buyers or sellers acted before. The test support levels begin at $0.8350. The resistance levels begin at $0.9602.
SUI Price Forecast: Bull, Base, and Bear Scenarios
Scenario | Trigger | Target |
Bull | Daily candle trades above the $0.9602 level | $1.0547 than $1.1419 |
Base | Daily candle stays inside the range | $0.8350 to $0.9602 |
Bear | Daily candle trades below $0.8350 | $0.6832 |
Bulls need spot volume to rise, not just futures. Bears gain ground if long losses outrun the recent 24-hour figure.
More token releases add supply, and a futures unwind can speed a drop. Technical invalidation arrives if the daily candle trades below $0.8350.
SUI Price Prediction November 2026: Expert Outlook
As per CoinGabbar analysis, the $SUI price prediction November 2026 tilts bearish while the price sits under the 50-day EMA. RSI reads 39.70, and the 30-day change is -21.57%. Longs took 71.5% of 24h losses.
But the channel support held at the $0.8350 level. The last 1 hour of liquidations was just $11.12K. So the stance is sell the bounce, not chase the drop.
Traders can also scan the latest crypto news for catalysts outside the chart. Macro news can move $SUI when the chart is quiet.
A daily candle that trades above $0.9602 on rising spot volume would end the lower-highs sequence. That would flip the bias.
Disclaimer: This article is for information only and isn't financial advice. Traders should do their own research and risk only what they can afford to lose.
0
0


 Manage all your crypto, NFT and DeFi from one place
Securely connect the portfolio you’re using to start.


