
Chainlink Price Prediction: Can Polymarket Lift LINK $12?

0
0

Can a prediction market's new gold and silver feeds drag LINK through a ceiling that sellers have defended for weeks?
Chainlink trades at $11.39 as of October 31, 2026, 05:30 UTC, pressed against the roof of a descending channel, meaning two downward-sloping lines that trap price. This Chainlink price prediction stays bearish below $12.016. A bounce toward $11.893 is still live. The Link:NYC build-up article covered the run into the event, and today's chart shows what followed.
LINK Price Today: Stuck at the Channel Roof
Data Snapshot
The LINK price today is $11.39, up 3.72% in 24 hours, per CoinMarketCap data at 05:30 UTC on October 31, 2026. Chainlink ranks 14th with an $8.52B market cap.
The 24-hour range runs from $10.90 to $11.70. Volume sank 45.9% to $458.3M, a 5.41% ratio to market cap. Green candle, shrinking crowd.
CoinGlass shows the 7-day change at -3.19%. And the 30-day change sits at -20.34%.
Chainlink News Today: 3 Catalysts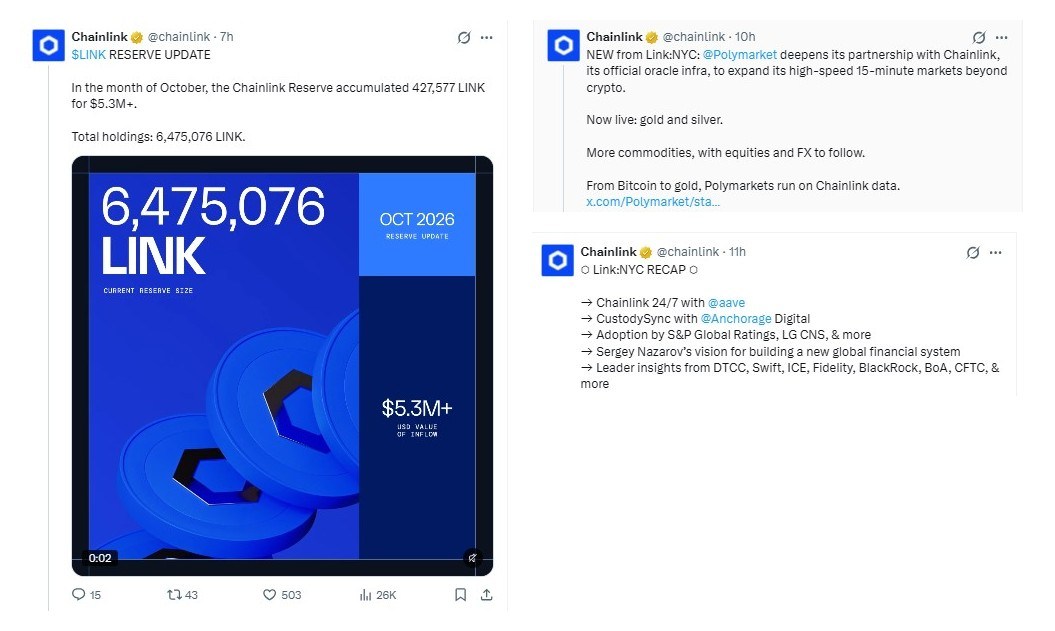
Breaking. Polymarket now runs its 15-minute gold and silver markets on Chainlink data. Chainlink is its official oracle infrastructure, the feed that brings real-world prices on chain. Commodities come next, then equities and FX. That's per the Polymarket announcement.
Link: NYC wrapped up with a recap. Chainlink 24/7 with Aave. CustodySync with Anchorage Digital. Adoption from S&P Global Ratings and LG CNS. Speakers from DTCC, Swift, BlackRock, and the CFTC.
Then the Chainlink Reserve, October buys totaled 427,577 LINK for $5.3M+, lifting holdings to 6,475,076 LINK. Enterprise revenue and onchain service fees fund it, and the buy equals 0.057% of circulating supply. Price rose. Volume didn't.
Chainlink Technical Analysis on the 4-Hour Chart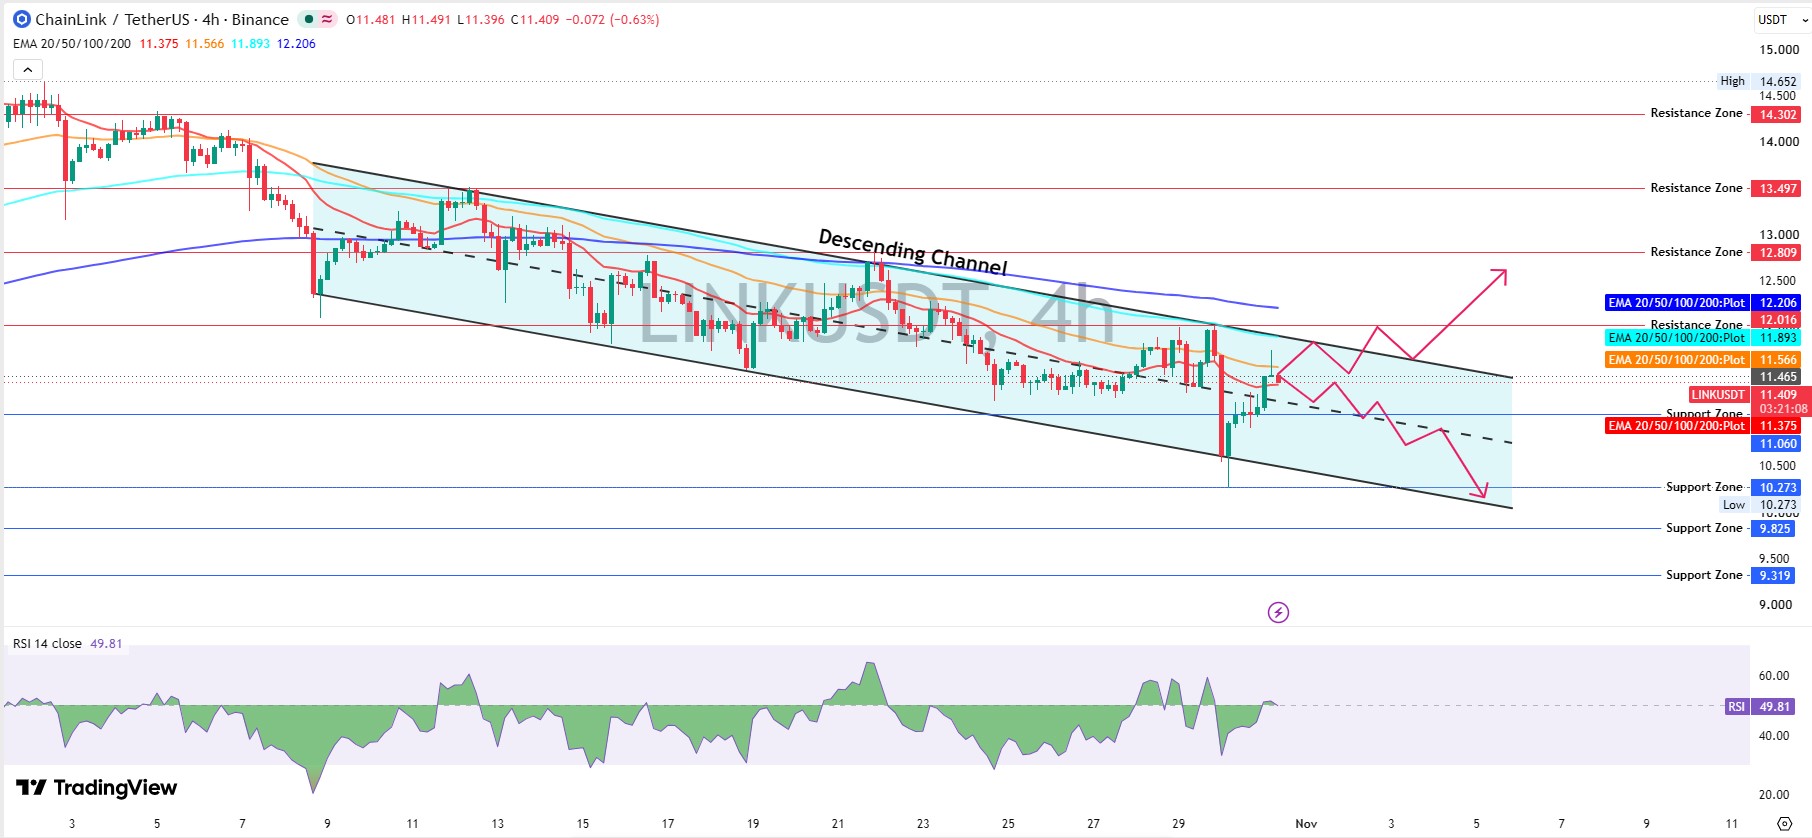
Descending Channel and EMA Stack
On the TradingView 4-hour chart for Binance, LINK has traded inside the descending channel for roughly 3 weeks. Chainlink technical analysis starts with the wick low of $10.273, a sharp bounce, and a Binance reading of $11.409 now.
An EMA is a moving average that weights recent trades more. The 20 EMA reads $11.375, the 50 EMA $11.566, the 100 EMA $11.893, and the 200 EMA $12.206. Price sits just above the first and under the other 3.
And the channel roof near $11.465 sits right there. A 4-hour trade above it, then above $11.566, would be the first real sign buyers are back.
RSI at Neutral
RSI, a 0 to 100 momentum gauge, reads 49.81. Call it bearish. Actually, that's too blunt for a gauge sitting at dead center. Sellers lead the structure, but nobody owns momentum.
An earlier oversold breakdown showed what real exhaustion looks like. This isn't it.
LINK Support and Resistance
LINK support and resistance start with the 20 EMA at $11.375, then $11.060, 3.1% below spot. Below that sits $10.273, about 10.0% lower, and $9.825 at 13.9%.
Overhead, the 50 EMA at $11.566 is 1.4% higher. Then $11.893, $12.016, and the 200 EMA at $12.206 stack up, with $12.809 waiting 12.3% above. Anyone tracking the gold angle can read the earlier gold channel test too.
Chainlink ETF Flows Turn Red
Chainlink ETF flows printed -$1.77M on October 30, 2026, per SoSoValue ETF data. That ended 9 flat sessions after a $397.26K outflow on October 16, 2026.
Grayscale's GLNK took all of it, while Bitwise's CLNK printed $0. Net assets fell to $195.20M from $206.99M a day earlier, and cumulative net inflow slipped to $177.46M.
But daily value traded was only $11.38M. So who's buying the next leg if fund money keeps leaving?
Futures and Holders
Futures Positioning
Shorts got hurt. CoinGlass shows $421.17K liquidated in 24 hours, and $302.60K of that was short. Liquidations are forced exits from leveraged bets.
Futures volume hit $595.87M against $136.12M in spot, per CoinGlass LINK data. Binance accounts lean long at 1.7012. And crowded longs add fuel if the price slips under $11.375.
Holder Concentration
Etherscan counts 913,711 holders. Whale wallets, meaning very large balances, number 4,017, just 0.44% of holders, yet they hold 90.51% of market cap, per Etherscan holder data.
But many top wallets are Chainlink's own noncirculating supply, so a big balance isn't automatic selling.
Chainlink Price Prediction Scenarios
A previous channel breakout attempt peaked near $12.44 before fading, so bulls need volume this time. The table covers the next 7 to 30 days.
Scenario | Trigger | Target | Invalidation | Liquidity Condition |
Bullish | 4-hour trading above $11.566, then $11.893 | $12.016, then $12.206 | Trading under $11.375 | Volume above $458.3M, ETF inflows return |
Base | Chop between $11.375 and $11.566 | Range holds | Either edge breaks on volume | Volume near $458.3M, flat ETF flows |
Bearish | 4-hour trading under $11.375, then $11.060 | $11.060, then $10.273 | Reclaim of $11.566 | Long liquidations rise, more fund outflows |
LINK Price Target by Timeframe
Next 7 Days
The LINK price target is $11.566 first, then $11.893 if buyers hold $11.375. Sellers keep the roof until a 4-hour trade clears $11.566.
Next 30 Days
An earlier monthly outlook drew a wider range. Chart structure now narrows it to $10.273 through $12.206, and the 30-day drop of 20.34% hands momentum to sellers.
Year-End Outlook
Enterprise adoption like the LG CNS partnership feeds the story. Price still needs a hold above $12.206 to open $12.809, then $13.497.
Risks That Change the Chainlink Price Prediction
Fund outflows are the first risk. A 4-hour trade under $11.060 would remove support and expose $10.273.
Altcoins also follow Bitcoin on risk-off days, as the market dip outlook explained.
Gold and silver feeds are live. Whether traders price them in before the roof gives way is the open question, and a 4-hour trade above $12.206 is the only answer that flips this call.
Disclaimer: This article is for educational market analysis only and isn't financial advice. Crypto assets are highly volatile, scenarios aren't guarantees, and readers should research independently before trading.
0
0

 Manage all your crypto, NFT and DeFi from one place
Securely connect the portfolio you’re using to start.


