
Why is crypto crashing? Here are 7 reasons bitcoin keeps falling

0
0
The crypto market is in free fall, and the reasons are stacking up. $Bitcoin slid to $55,150 early on Saturday, 21 November 2026, its lowest level since September 2024, before bouncing to $57,924 at 10:00 UTC. That still leaves it 6% lower on the day and 14% lower on the week. $Ethereum trades at $1,636 and $XRP at $0.89. The total crypto market cap has shrunk to $1.99 trillion, and the Fear and Greed Index sits at 7, deep in extreme fear. Here are the seven forces behind the crypto crash.
| Coin | Price | 24h | 7 days |
|---|---|---|---|
| $BTC | $57,924 | -6.1% | -14.0% |
| $ETH | $1,636 | -6.3% | -14.4% |
| $BNB | $524.83 | -8.0% | -15.2% |
| $XRP | $0.8935 | -6.5% | -9.8% |
| $SOL | $67.97 | -5.6% | -10.4% |
Prices as of 21 November 2026, 10:00 UTC. Live data on our crypto prices page.
Why is crypto crashing today? The short answer
There is no single trigger. Rising interest rates, a sell-off in AI stocks, ETF outflows and a wave of forced liquidations are hitting at the same time, and each one feeds the next. Bitcoin still closed above $80,000 on 4 November. At Saturday's low, it had lost more than 30% in roughly two weeks.
7 reasons why crypto is crashing right now
1. Is the Fed about to hike interest rates in December?
Yes, and that is the heaviest weight on crypto right now. October consumer prices rose 0.4% on the month, more than expected, and Fed Governor Christopher Waller argued for a half-point hike in December, warning that a smaller move would put the Fed's credibility at risk (more on Waller's warning). By mid-November the CME FedWatch tool priced a December hike as a near certainty. The decision is due on 9 December.
Higher rates make cash and bonds more attractive and drain liquidity from risky assets. The last time the Fed hiked aggressively, in 2022, bitcoin fell 60%. Pressure is coming from Japan too: with the yen near 159.6 per dollar, markets expect a Bank of Japan hike in December, which threatens the cheap yen funding behind many leveraged trades.
2. Is the AI stock crash dragging bitcoin down?
It is. On 5 November the Nasdaq fell 5.5%, its worst session since April 2025, as doubts about the returns on AI infrastructure spread through chip stocks. The selling never really stopped. By Friday the Nasdaq had wiped out its entire 2026 gain, and Nvidia sank to $135, its lowest price since May 2025. A day earlier, the Dow dropped 1,000 points as the VIX jumped to 28.
In phases like this, bitcoin trades like a high-beta tech stock. When funds cut risk, crypto is usually the first thing they sell, because it trades around the clock and can be sold on a Saturday morning when stock markets are closed.
3. Are bitcoin ETF outflows making the crypto crash worse?
The spot ETFs that drove much of the buying over the past two years have turned into sellers. Another $152.7 million in net outflows hit the funds in the latest session, on top of weeks of redemptions. The pattern is the same across coins: ether ETFs keep bleeding, Solana ETFs shed $122.7 million in 30 days, and assets in US spot XRP ETFs have slipped below $1 billion, to about $990 million.
ETF flows matter because they are the cleanest window into what institutions are doing. As long as they stay negative, every bounce runs into fresh supply.
4. How much leverage was liquidated in the crypto crash?
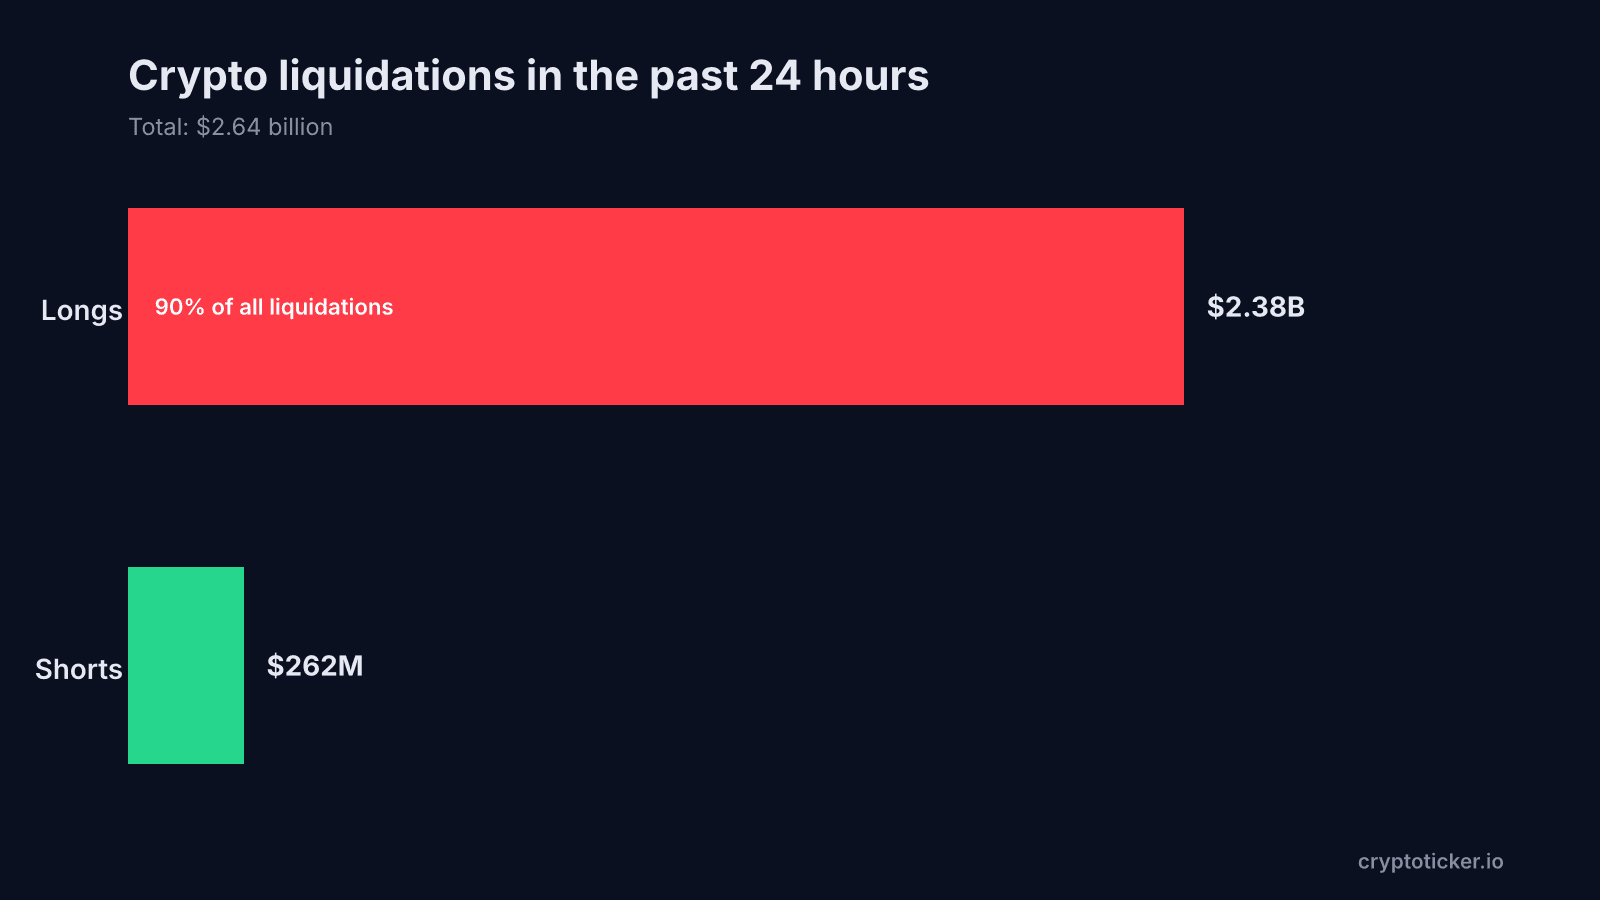
A lot. When bitcoin lost $60,000 on Friday evening, $553 million was liquidated in a single hour. Over the full 24 hours, liquidations across the crypto market reached $2.64 billion, and $2.38 billion of that, or 90%, came from long positions betting on higher prices.
This is how a correction turns into a crash. Every forced sale pushes the price into the next cluster of stop losses and liquidation levels, which triggers the next wave of selling. Open interest still stands at around $318 billion, so there is plenty of leverage left to flush out. You can follow the numbers on our crypto charts page.
5. Will Strategy have to sell its bitcoin?
That is the question hanging over the market. According to Strategy, the company holds 850,849 bitcoin at an average cost of $75,452. At $57,924, the stack is worth about $49.3 billion, roughly 23% below cost, an unrealised loss of around $14.9 billion. The company's mNAV has fallen below 1, which means the stock is now worth less than the bitcoin it holds, and MSCI is removing it from its indexes, forcing passive funds to sell MSTR shares.
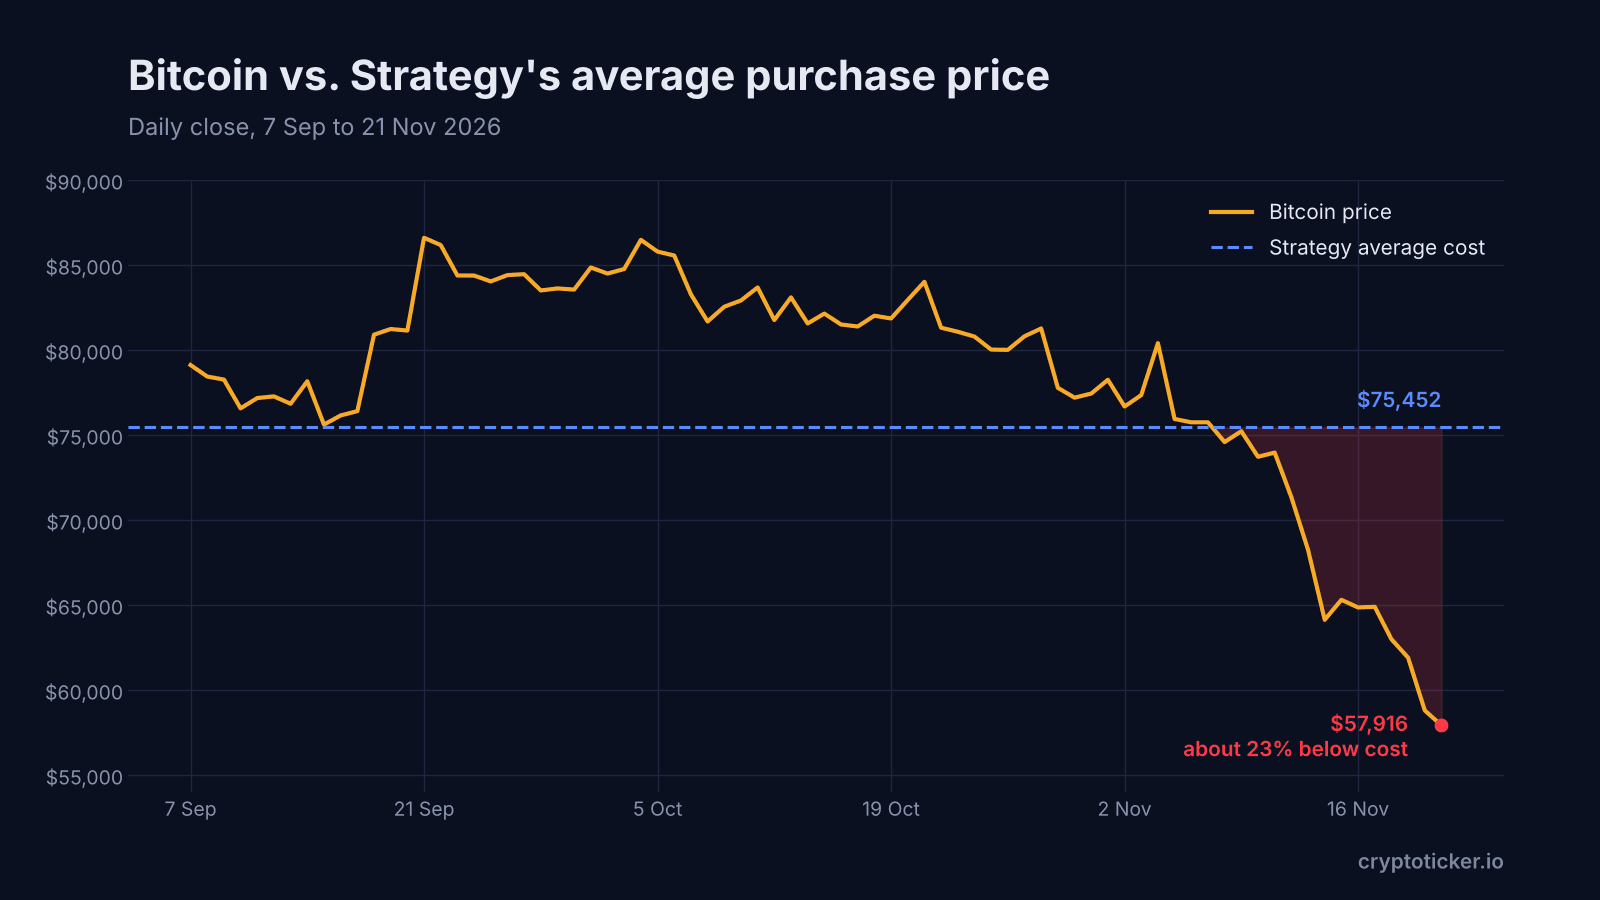
Strategy has not sold any bitcoin. But the market is pricing the risk that the biggest corporate buyer could one day turn into a seller, and that fear alone weighs on sentiment.
6. Did the Binance hack shake trust in crypto?
It left a mark. The $6.34 billion theft from Binance on 29 October is the largest crypto hack on record. Binance says about $2.85 billion was frozen or intercepted and that 98% of the affected assets were replenished by 31 October, while the FBI attributes the attack to North Korea. Customers were made whole, but smaller incidents since then, from Lighter's $10.4 million drain to a data breach at a Trezor shipping partner, have kept security at the top of the worry list.
7. Are whales and governments selling bitcoin?
Supply is rising just as demand fades. A Leipzig court has floated handing over 40,000 bitcoin from the Movie2k case, worth about $2.3 billion at today's price, and traders fear the coins could end up on the market. On top of that, on-chain data shows whales and miners distributing about 48,600 BTC over the past two weeks.
Bitcoin price prediction: where is the bottom?
The chart has turned clearly bearish. Bitcoin broke the $60,000 floor of its range and briefly lost the July low at $57,700. As long as it trades below $60,000, that level acts as resistance. The next support is Saturday's low at $55,150. Below that, Wintermute has flagged the $50,000s as the zone that decides the bigger trend.
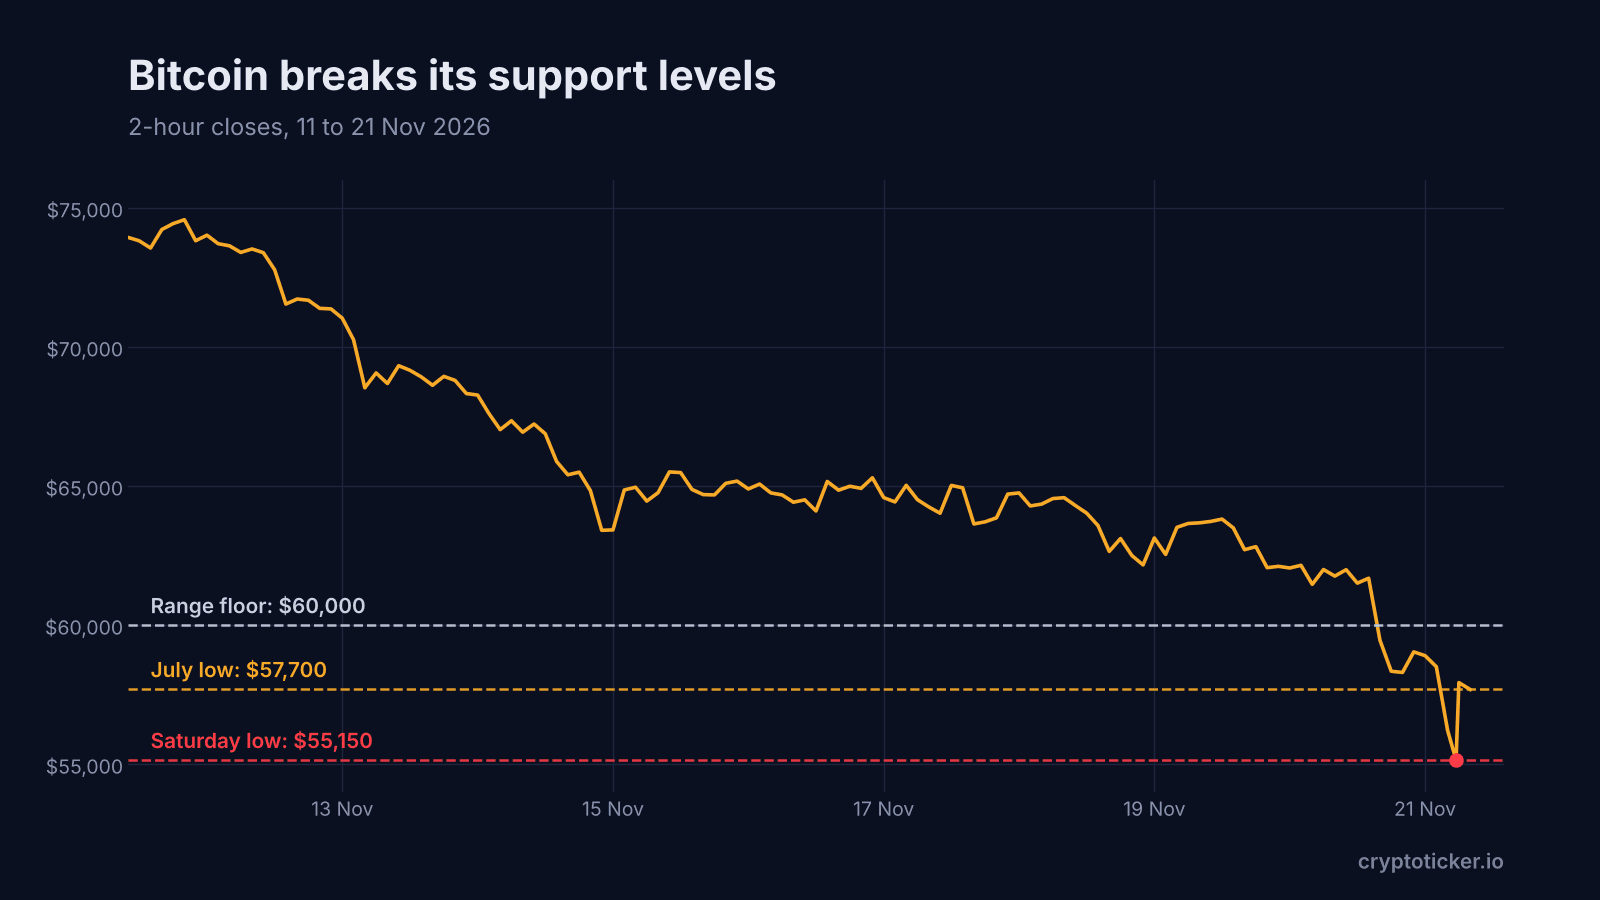
Extreme fear readings like today's 7 have often shown up near local lows, but they are not a buy signal on their own. The dates to watch: the MSCI index change at the end of November, the Fed decision on 9 December and the Bank of Japan meeting later in December. Until rates and tech stocks calm down, rallies are likely to be sold.
What should crypto investors do during the crash?
Stay away from leverage, which is what turned this sell-off into a crash. Check that you can hold your positions through further drops without being forced to sell, and keep coins you do not trade in your own wallet. For minute-by-minute updates, follow our bitcoin crash live ticker.
0
0

 Manage all your crypto, NFT and DeFi from one place
Securely connect the portfolio you’re using to start.
 Where will Bitcoin trade next?
Live Polymarket and Kalshi odds on Bitcoin price targets, compared side by side.
See Bitcoin price odds


