
Sui Price Prediction: Can the Falling Wedge Break $0.94 Today?

0
0

Is a falling wedge about to trap sellers on SUI?
That's the question behind this Sui price prediction at 10:00 UTC on Oct 27, 2026. SUI trades at $0.9042, and the squeeze on the 4-hour chart tightens daily.
Sellers still run the trend, and the descending channel support fight from last week never really ended. A SUI price forecast needs exact levels, so the sections below give them.
SUI Price Today: Market Snapshot
Market figures below were read at 10:00 UTC on Oct 27, 2026.
Metric | Value |
Price | $0.9042 |
24h change | -1.54% |
Market cap | $3.72B (rank 26) |
24h volume | $334.47M |
Circulating supply | 4.11B of 10B |
Another 5.89B tokens sit outside circulation, per CoinMarketCap market data. But the price already trades 83.08% under the $5.35 peak from Jan 6, 2025.
Why Is SUI Down Today?
Sellers pushed SUI under $0.9276 and pinned it near $0.9033, a 1.54% slide in 24 hours. Volume rose 3.4% during the drop.
That's far from the earlier SUI volume surge behind past rallies. Weekly losses run -9.36% over 7 days and -22.35% over 30 days.
Native USDC News: Does It Move SUI Price?
Breaking. Sui Network posted around 18:00 UTC on Oct 26, 2026, that native USDC just hit two years on the chain, per an official Sui Network post. CCTP V2 is live. It links Sui to 29 chains.
USDC sends on Sui now cost zero gas. Great news, but price ignored it, and SUI still slipped 1.54% on the day.
SUI Technical Analysis: The Falling Wedge Story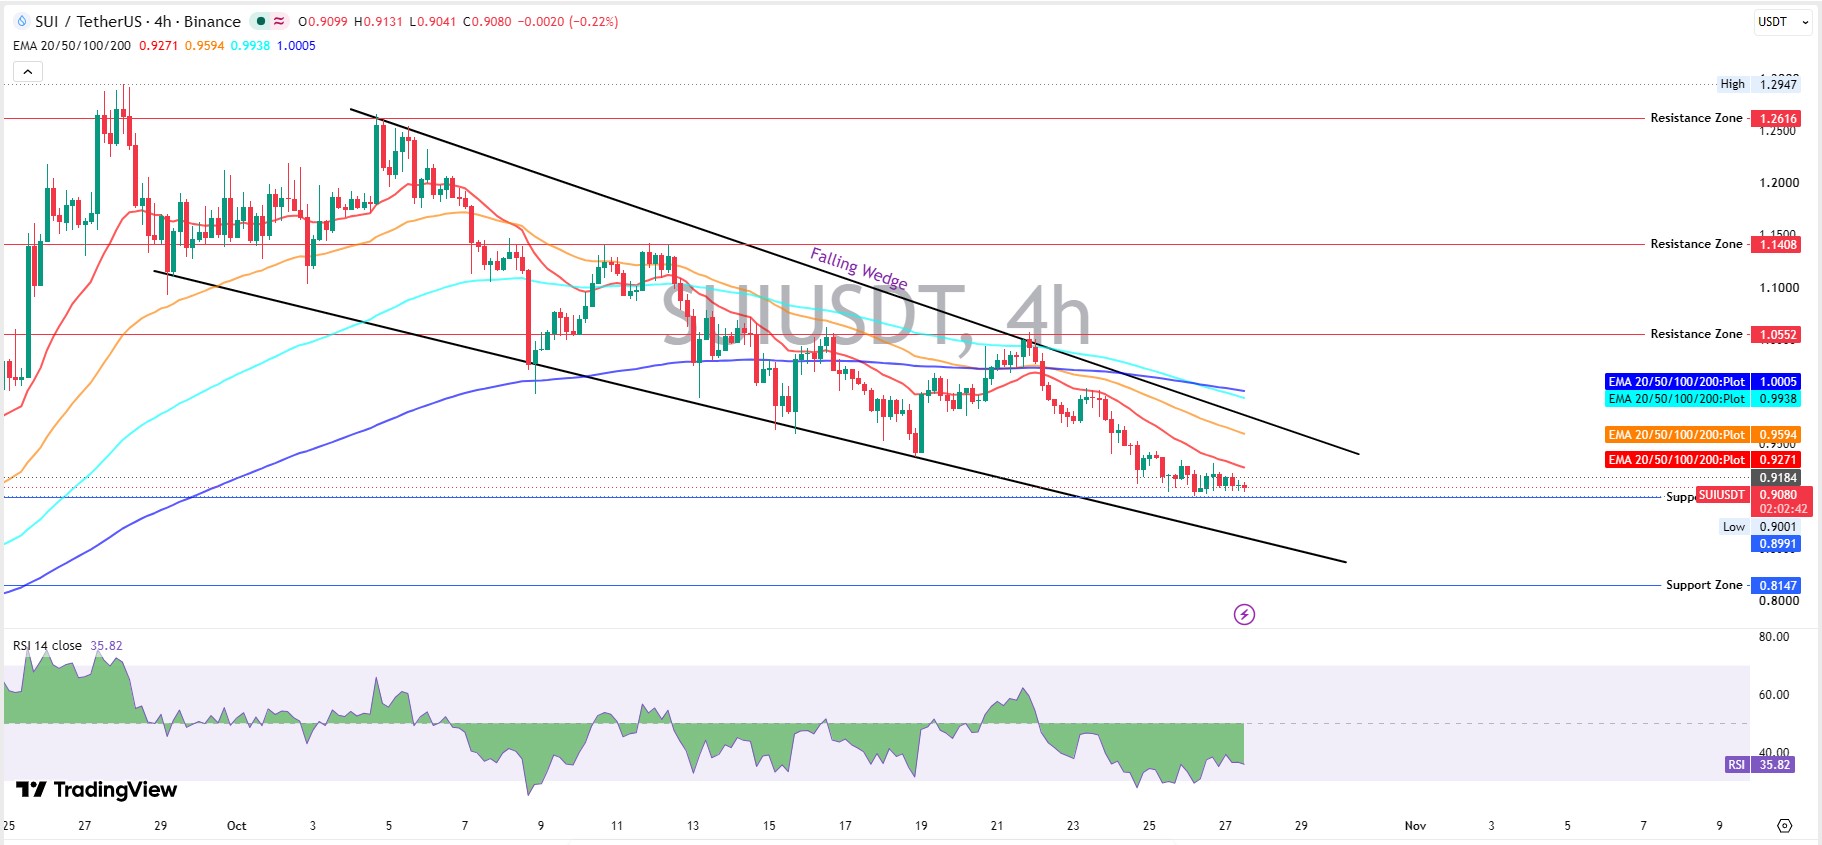
A falling wedge is squeezed together. It often resolves upward, though no pattern guarantees that.
SUI has traced one on the Binance 4-hour chart since its Oct 5, 2026 peak, as the TradingView chart shows. Each bounce topped lower than the last.
By chart reading, the ceiling sits around $0.94 today. Price hugs the floor at $0.9080.
Support and Resistance Levels
Support starts at $0.8991, with $0.8147 as the deeper floor. Resistance stacks at $1.0552 and $1.1408, then $1.2616, with the $1.2947 swing high on top.
If $0.8991 breaks, then $0.8147 is the next stop, 9.9% below the spot.
What RSI and EMA Lines Say
RSI, a 0 to 100 momentum gauge, reads 35.82. Under 50 favors sellers, yet it hasn't reached the 30 line where oversold bounces tend to start.
An EMA is an exponential moving average, a trend line that weighs recent prices more. The 20-day sits at $0.9271, the 50 at $0.9594, the 100 at $0.9938, and the 200 at $1.0005.
Exchange Volume: Where SUI Trades
Binance leads futures volume at $164.77M on CoinGlass volume data, followed by MEXC at $71.29M and OKX at $57.89M.
Binance alone moves 2.8 times the volume of OKX.
SUI Derivatives Data: Who Holds the Longs?
Binance accounts sit at a 1.8802 long/short ratio, OKX at 3.07, and top Binance traders at 2.375.
So who sells into a market where longs outnumber shorts roughly 2 to 1?
Open interest, the total value of open futures bets, stands at $644.09M, and this open interest explained guide shows how to read it. Liquidations hit $325.93K in 24 hours, with longs at $191.17K.
But shorts lost $134.76K, so squeezes cut both ways.
Sui Price Prediction Scenarios
Each path ties to a level on the 4-hour chart.
Scenario | Trigger | Target | Invalidation | Liquidity Condition |
Bullish | 4-hour trade above $0.94, then $0.9594 | $1.0552, then $1.1408 | Trade under $0.9271 | Futures volume above $522.94M |
Base | Range of $0.8991 to $0.9594 | $0.90 to $0.96 | Break of either edge | Volume near $334.47M |
Bearish | 4-hour trade under $0.8991 | $0.8147 | Trade above $0.9271 | Long liquidations above $191.17K a day |
Bullish Scenario
Bulls need a 4-hour trade above the $0.94 ceiling, then a hold over the 50-day EMA at $0.9594. That opens $1.0552, 16.7% above spot, as this Sui Basecamp bull run outlook also flags.
Base Scenario
The price most likely chops between $0.8991 and $0.9594 through Nov 3, 2026. And every bounce meets sellers fast near the 20-day EMA at $0.9271.
Buyers keep defending $0.90, and yet each defense draws a weaker bounce.
Bearish Scenario
A 4-hour trade under $0.8991 breaks the floor. SUI lost 22.35% across 30 days.
Key Levels to Watch Before November
Breakout confirmation needs a 4-hour trade above $0.94 with rising futures volume. Breakdown risk starts under $0.8991.
Traders tracking similar crypto price predictions will see the same pivot zones.
Sui Price Prediction for November 2026
The base range for Nov 1 to Nov 30, 2026 UTC, runs $0.85 to $1.00, as the SUI November outlook also maps. Bulls win the month only above $1.0552.
SUI Price Forecast for Year-End 2026
In the short term, the 24-hour range runs from $0.8991 to $0.9271 on Oct 28, 2026. Over 7 days, $0.88 to $0.96 fits.
By Dec 31, 2026, a confirmed breakout points to $1.1408 and then $1.2616, which is 39.5% above the spot. A Bitcoin capital rally would help only once real money shows up.
This Sui price prediction stays bearish while the price trades under $0.9594.
Risks That Break the SUI Setup
With 5.89B tokens outside circulation, any release adds sell orders when demand thins. A failed breakout at $0.94 sends the price back to $0.8991.
And altcoins rarely rally against Bitcoin, a link tracked in the Bitcoin price prediction hub.
Disclaimer: This article is for information only and isn't financial advice. Crypto prices swing sharply, so traders should research independently and manage risk before making any decision.
0
0

 Manage all your crypto, NFT and DeFi from one place
Securely connect the portfolio you’re using to start.


