
Ethereum Beats Bitcoin in Q3 as Spot ETF Inflows Reverse Months of Outflows

0
0

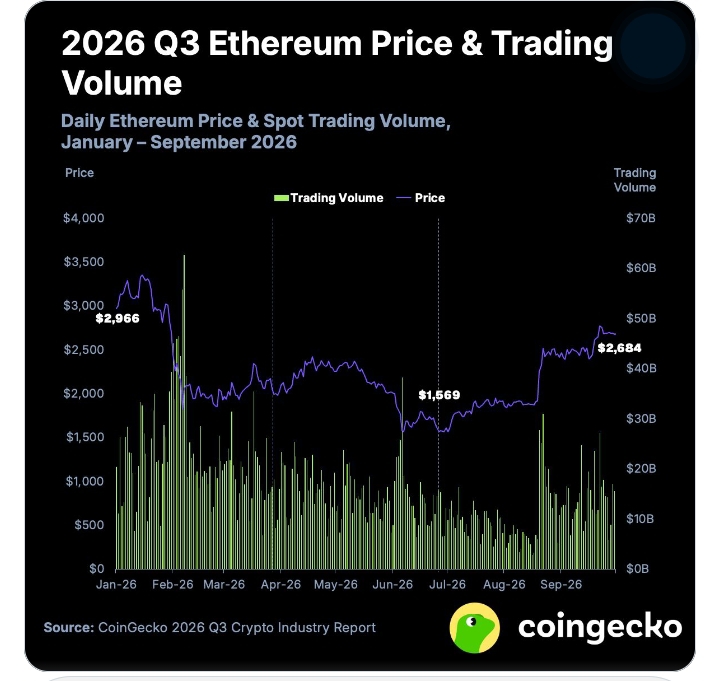
Ethereum beats Bitcoin in Q3, and the gap was wide. CoinGecko’s Q3 report shows ETH climbed 71.0% to $2,684. That broke a three-quarter losing streak.
US spot ETH ETFs took in $3.1B in net inflows, which reversed all outflows from the first half of 2026.
How Did ETH Beat Bitcoin?
Bitcoin rose 42.7% over the same quarter, to $83,576. The shift began in July, when ETH gained about 22% against roughly 9% for Bitcoin.
Fund flows did much of the work. ETH ended the quarter at $2,684, after a low near $1,569 in June.
CoinGecko’s chart shows it started the year near $2,966. Bitcoin funds also saw demand fade lately, as Bitcoin ETF inflows collapsed 88% in early October.
Did Participation Match the Price?
Not fully. ETH’s average daily trading volume fell 23.2% to $11.5B, down from $15.0B in Q2. CoinGecko says prices rebounded faster than participation.
The Glamsterdam upgrade also missed the quarter and reached the Sepolia testnet on 6 October.
Network questions go beyond price, since Ethereum Layer 2 safety depends on risks that volume and speed cannot show.
ETH Gives Back Some Gains
At about 11:10 UTC on 19 October 2026, ETH traded at $2,418.13. That is down 5.0% over seven days and about 9.9% below the Q3 close. The BTC pair stood at 0.02936388.
The seven-day chart opens near $2,540 on 13 October. Price dipped to about $2,420 that day, then rebounded to $2,530.
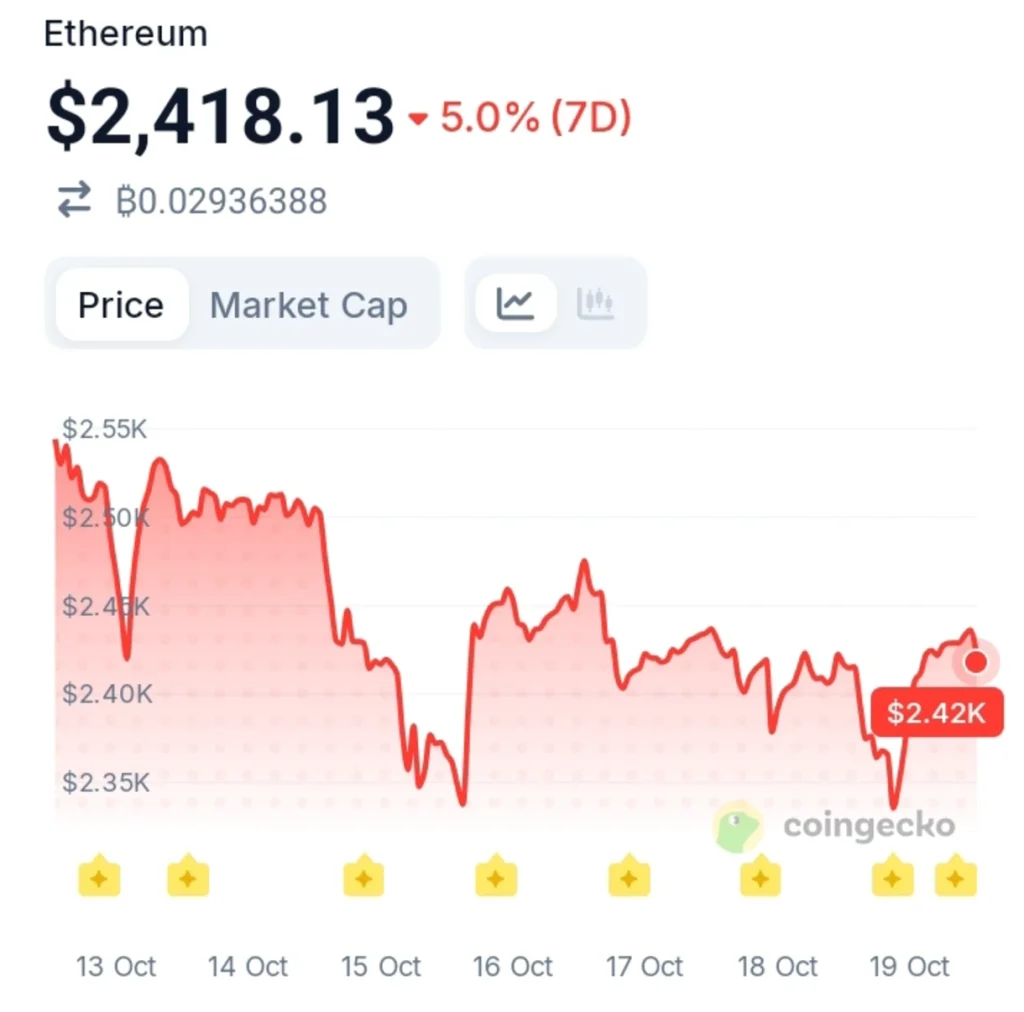
ETH slid to about $2,340 on 15 October and bounced to a peak near $2,475 on 16 October. Sellers returned over the weekend.
Price touched a low near $2,330 on 19 October before recovering to $2,430. Supply is thin on exchanges, as Ethereum exchange liquidity hit a 7-month low on Binance.
The Reversal Risk
Flows can turn as fast as they arrived. US spot Ethereum ETFs lost $542M in the week to 9 October. BlackRock’s ETHA accounted for $477M of that.
Another $60.22M left on 15 October. Q3 showed what steady inflows can do. October shows how fast they can fade.
Disclaimer:
This article is for informational purposes only and does not constitute financial, investment, or trading advice. The views expressed are based on publicly available data, market observations, and the author’s interpretation at the time of writing. Cryptocurrency markets are highly volatile and unpredictable, and past performance or current technical setups do not guarantee future results. Readers should conduct their own research and consult with a qualified financial advisor before making any investment decisions. TechGaged does not accept liability for any losses incurred based on the information presented.
The post Ethereum Beats Bitcoin in Q3 as Spot ETF Inflows Reverse Months of Outflows appeared first on TechGaged.
0
0


 Manage all your crypto, NFT and DeFi from one place
Securely connect the portfolio you’re using to start.
 Where will Bitcoin trade next?
Live Polymarket and Kalshi odds on Bitcoin price targets, compared side by side.
See Bitcoin price odds


