
Zcash Price Prediction: Can ZEC Defy ETF Outflows and Break $1,320?

0
0
Can ZEC break $1,320? It is 0.6% away. In this Zcash Price Prediction, ZEC trades at $1,313.11 after an 11% rally in two days, at the top of a range it has held since October 8.
Shorts took about 81% of the $18.29M liquidated in 24 hours. A trader calls the rally strong, while a post says spot ZEC ETFs have had three straight days of outflows.
Market data checked on November 5, 2026, at 09:38 IST.
Why is Zcash price up today?
The Zcash price today is up 13% to $1,316.42 in 24 hours, significantly outperforming Bitcoin's +6.12% gain, primarily driven by anticipation of its imminent NU7 network upgrade.
Primary reason: Pre-upgrade speculation ahead of the NU7 activation, scheduled for around November 5, which promises faster transactions and new fee economics.
Secondary reasons: A surge in derivatives positioning and a technical breakout above key resistance, amplifying the bullish momentum.
Zcash News: "Extreme Strength" on the 4-Hour Chart
ZEC on the 4-hour chart is showing extreme strength in the relief rally in crypto. He says the setup was an "OS Bottom" signal that started a stage 2 uptrend. The post does not explain the signal.
He adds that strength after a correction often signals further outperformance if markets keep rising and says to watch that ZEC holds his red zone, resistance that has turned support.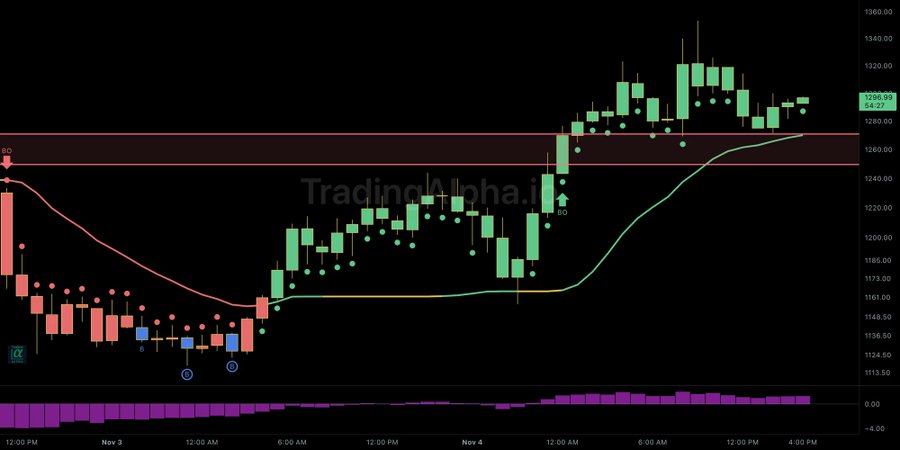
The 4-hour chart and the red zone's price were not shown, so CoinGabbar could not verify it.
Source: Data From X
Zcash News: Spot ETFs Post 3 Straight Days of Outflows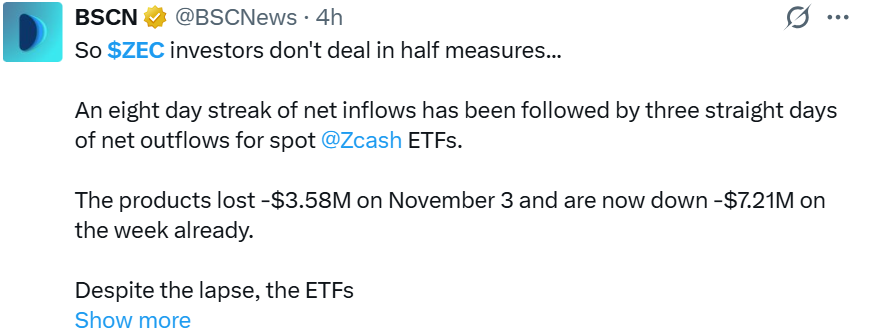
The eight-day streak of net inflows has been followed by three straight days of net outflows for spot Zcash ETFs. An ETF is a fund that trades on a stock exchange like a share.
The post says the products lost $3.58M on November 3, are down $7.21M in the week, and still hold 3.43% of ZEC's supply.
The post names no fund or data source, so CoinGabbar could not verify the figures.
ZEC Liquidation Data
A liquidation is a forced close of a leveraged trade when the trader can no longer cover losses. Longs bet on a rise, and shorts bet on a fall.
Window | Total Liquidated | Long | Short |
12h | $2.65M | $1.63M | $1.02M |
24h | $18.29M | $3.40M | $14.89M |
Source: Data From CoinGlass
Shorts took about 81% of the $18.29M liquidated over 24 hours, which fits a rally that forced short sellers out. About 85% of the total came in the earlier 12 hours.
Zcash Outlook: Technical Analysis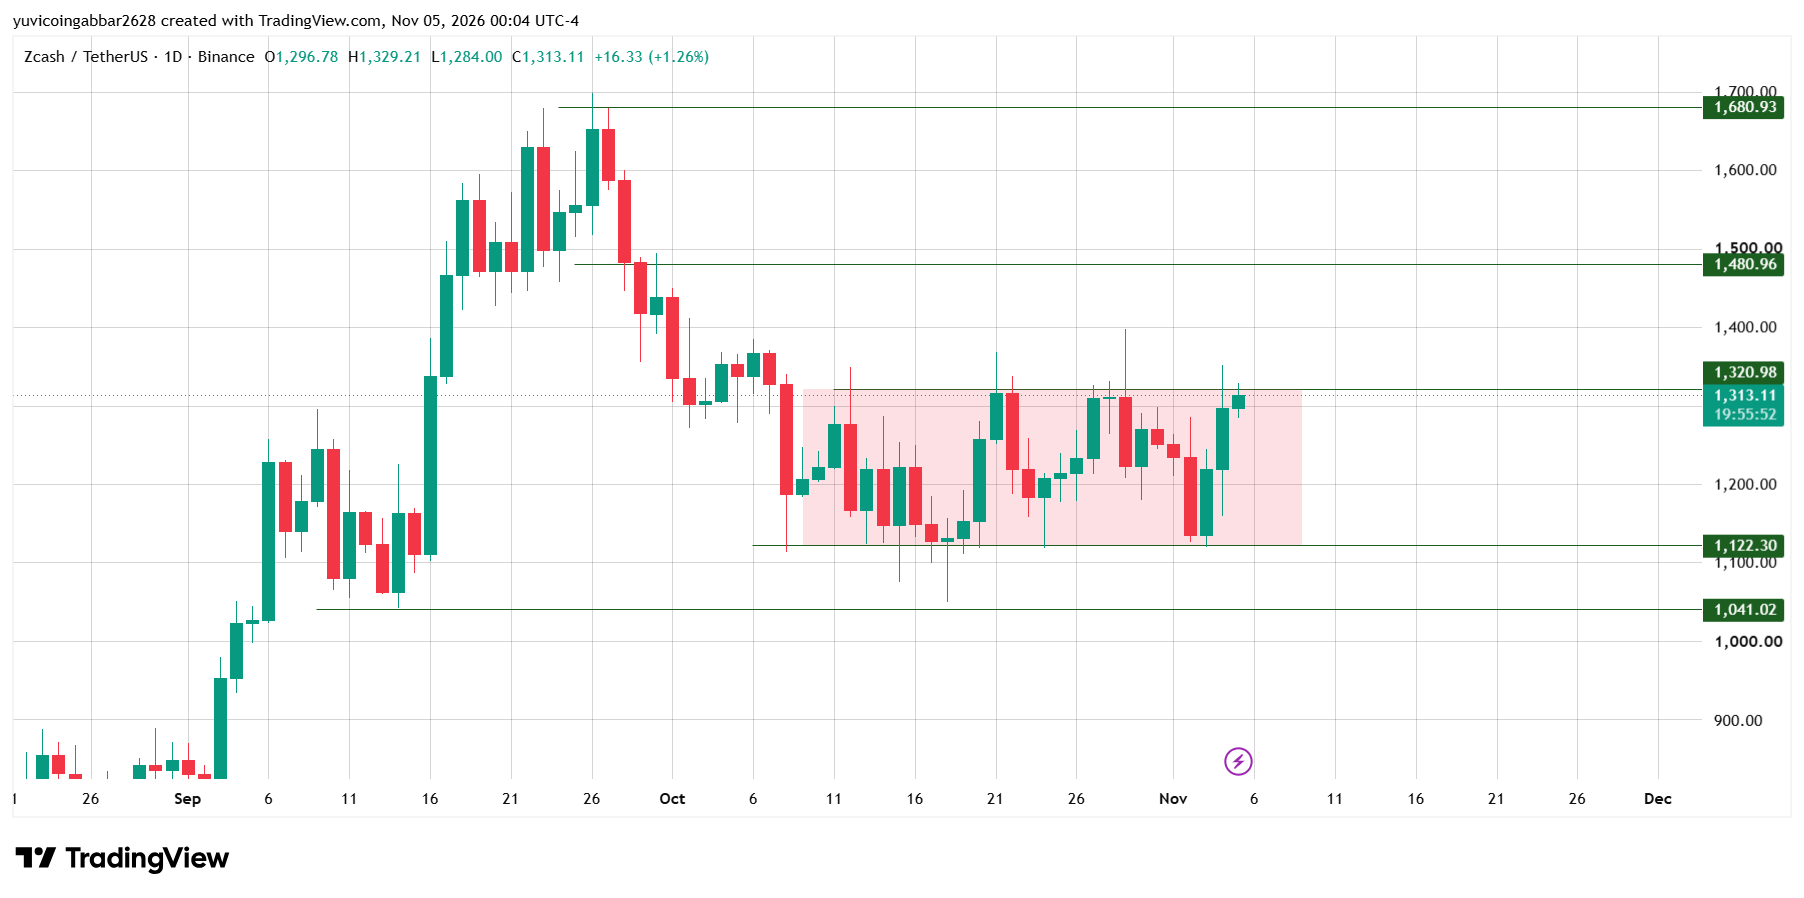
$ZEC peaked near $1,700 in late September. Since October 8, it has traded in a range, a sideways band between a floor and a ceiling, marked in red from $1,122.30 to $1,320.98.
Yesterday's candle opened at $1,219.02, dipped to $1,158.88 and closed near $1,296.78, a gain of about 6.4%.
Today's candle opened there, reached $1,329.21 and printed $1,313.11, just under the ceiling. It was still open, so the close can change. Our November 4 bull case, a close back above $1,201.01, has now happened.
Zcash Forecast: Support and Resistance Levels
Type | Level |
Highest marked level | $1,680.93 |
Resistance 2 | $1,480.96 |
Resistance 1 | $1,320.98 |
Immediate support | $1,122.30 |
Deeper support | $1,041.02 |
Bull case: A daily close above $1,320.98, less than 1% higher, would end the range and put $1,480.96 in view.
Bear case: If ZEC is rejected and closes below $1,122.30, about 15% lower, the price could slide toward $1,041.02.
ZEC Scenarios and Invalidation (November 5, 2026)
Scenario | Trigger | Likely Outcome | Invalidation |
Bull | Close above $1,320.98 | Move toward $1,480.96 | Close back below $1,320.98 |
Base | Range of $1,122.30 to $1,320.98 | Sideways inside the range | Break of either level |
Bear | Close below $1,122.30 | Slide toward $1,041.02 | Close back above $1,122.30 |
Zcash Prediction: Can Zcash Reach $1,680.93?
It would take a gain of about 28% from $1,313.11. Any ZEC price prediction toward it needs more than a relief rally.
Zcash Price Prediction 2026: Expert View
$ZEC rose fast, but the short squeeze and ETF outflows point in different directions. The level to watch is $1,320.98.
A daily close above it would be the first real sign of strength, while a rejection would keep $ZEC inside the range.
Disclaimer
This article is for informational purposes only and isn't financial advice. Crypto markets are volatile. Always do your own research before making any trading decisions involving ZEC.
0
0

 Manage all your crypto, NFT and DeFi from one place
Securely connect the portfolio you’re using to start.


