
XRP Slips Toward $0.89 as Bears Control Weekly Chart: Can Bulls Hold?

0
0
XRP fell to about $0.89 over the weekend, its lowest daily close since November 2024. Buyers stepped in and pushed it back, and the token now trades near $0.9523, down 0.46% in 24 hours.
That still leaves it roughly 75% below its all-time high of $3.842. The coin lost nearly 12.49% over seven days and 27% over the past month.
Leverage and Open Interest Drop to 2024 Lows
As per the tweet, The estimated leverage ratio for XRP futures on Binance fell to around 0.13. That is the lowest reading since November 2024. Earlier in 2025, the ratio was close to 0.60.
Binance open interest also dropped to about $325 million. It topped $1.5 billion earlier in 2025.
Both numbers point to cooler speculation. Fewer traders are using leverage, and fewer are opening new positions, long or short.
Across all exchanges, open interest sits at $1.96 billion, down 2.03%. The funding rate is slightly negative at -0.0051%, which hints at a mild bearish tilt in futures.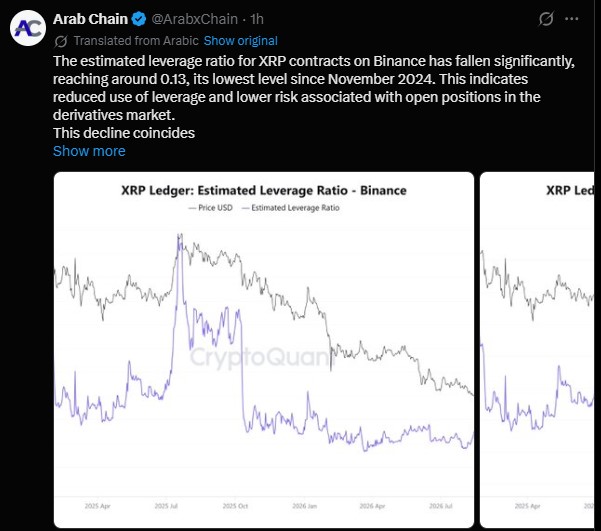
Key Market Data
Metric | Value |
Current price | $0.9523 |
24h low / high | $0.9427 / $0.9777 |
Market cap | $60.57 billion |
24h spot volume | $518.73 million |
24h futures volume | $2.23 billion (-54.29%) |
Open interest | $1.96 billion (-2.03%) |
Funding rate | -0.0051% |
24h liquidations | $3.45 million (63% longs) |
Futures to spot volume | 4.3x |
ETF net inflow (Nov 13) | -$1.1 million |
Fear & Greed Index | 10 (Extreme Fear) |
Liquidations were small, so the drop was not a forced flush. The Fear & Greed Index at 10 shows how nervous the market feels.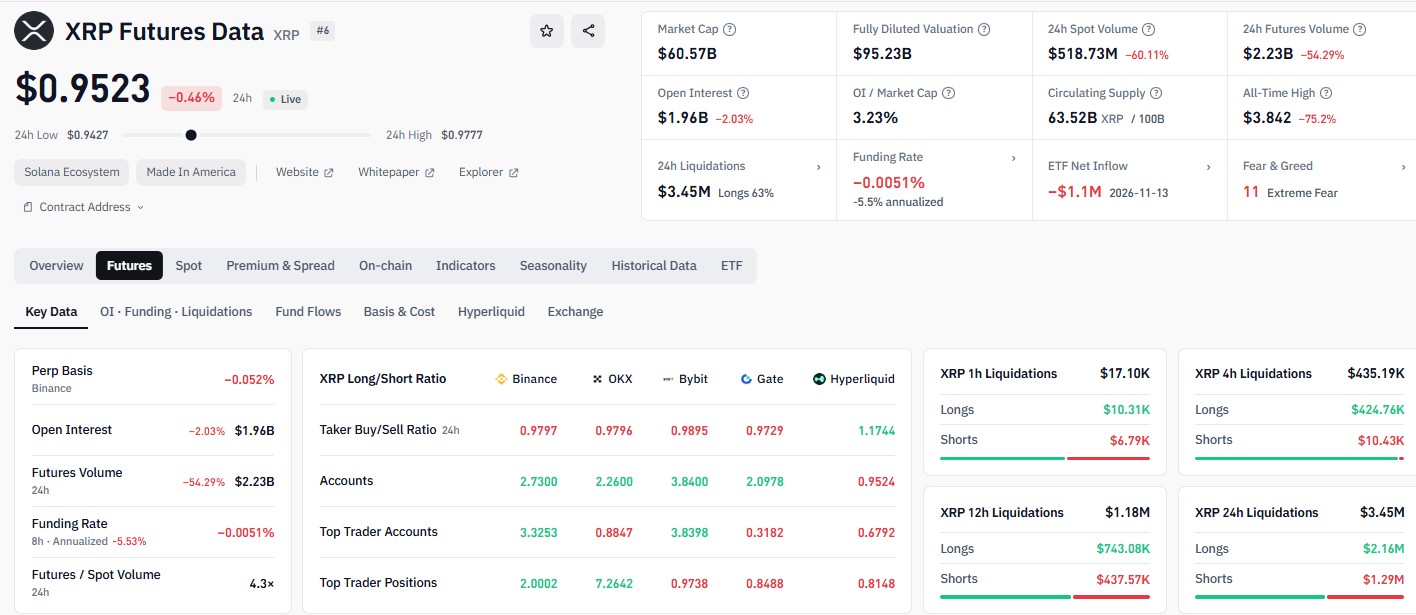
Weekly Chart Stays Bearish
On the weekly chart, the token keeps printing lower highs and lower lows. It failed to hold the $3.00 to $3.50 region and slid from there.
Price now sits below all four major EMAs. The 20-week EMA is at $1.2467, the 50-week at $1.4370, the 100-week at $1.5317, and the 200-week at $1.3605.
The break under the $1.20 to $1.30 zone hurt the structure further. RSI reads 35.24, which shows weak momentum and a market getting close to oversold.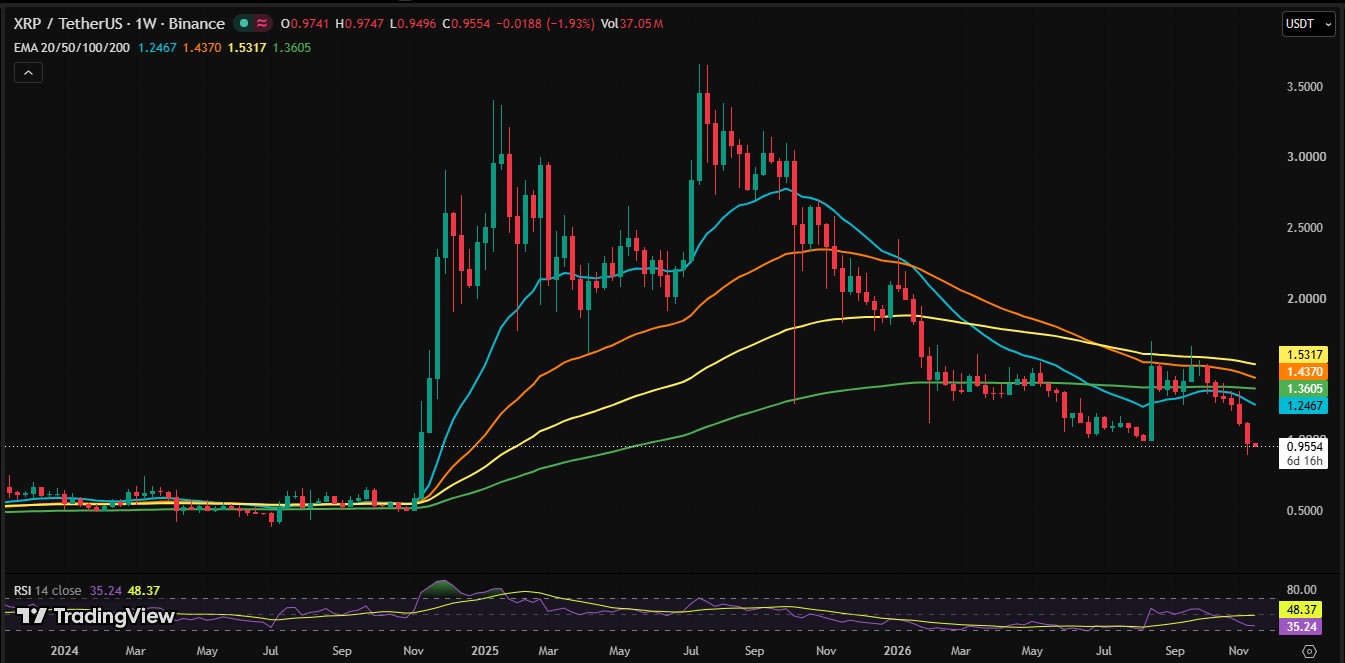
There is one long-term note from ChartNerd. XRP has only swept below its 2-month upper regression band five times in history. Past sweeps after cycle peaks were followed by accumulation, and later expansion.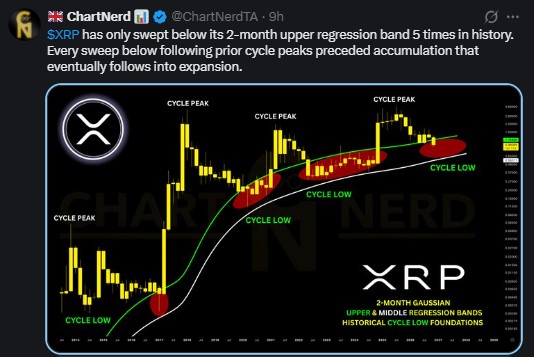
That is history, not a timer. It does not say when a bottom forms.
Levels Traders Are Watching
Level | Role | What it means |
$0.85 to $0.90 | Support | First area if the weekend low gives way |
$0.70 to $0.75 | Support | Next zone if selling continues |
$1.25 | Resistance | A move above is an early bullish sign |
$1.36 to $1.53 | Resistance | 200, 50 and 100-week EMAs sit here |
What Could Happen Next
The bearish case is simple. If buyers cannot hold $0.89, the chart opens a path toward $0.85 to $0.90, then $0.70 to $0.75.
The other side needs more work. A recovery above $1.25 would be the first sign of a shift. A sustained move above $1.36 to $1.53 would be needed to strengthen any reversal.
Low leverage can cut both ways. It lowers the risk of sharp liquidation cascades, but it also shows traders are not ready to place big bets yet.
For now, the weekly trend stays down. This is a technical scenario, not a guaranteed outcome.
Disclaimer
This article is for information only and is not financial advice. Crypto assets are highly volatile, and prices can move fast in either direction. Always do your own research and speak with a licensed financial advisor before investing. Never risk money you cannot afford to lose.
0
0

 Manage all your crypto, NFT and DeFi from one place
Securely connect the portfolio you’re using to start.


