
Zcash Price Prediction: Can ZEC Hold $863.52 After ETF Outflows?

0
0

Can ZEC buyers defend $863.52 support after the October range broke?
This Zcash price prediction begins with ZEC at $989.18, and the price is up 1.2% on the day. Earlier coverage of the NU7 upgrade price setup adds background on the coin, though the latest data matters more here. ZEC now sits under its broken October range.
Zcash Price Forecast: 24-Hour Market Snapshot
As of 8:10 UTC on Nov 12, 2026, CoinGecko market data puts $ZEC at $989.21, a 1.2% gain over 24h.
| Metric | Value |
| Price | $989.21 |
| 24h change | +1.2% |
| 24h range | $951.49 to $1,021.92 |
| Market cap | $16.852B |
| Market cap rank | 11 |
| FDV | $16.853B |
| 24h volume | $981.104M |
| Circulating supply | 17.036M ZEC |
| Max supply | 21M $ZEC |
Source: CoinGecko, ZEC market data, captured Nov 12, 2026, 8:10 UTC
ZEC Price Today: Support Levels and the 24h Range
$ZEC trades $37.69 above its 24h low of $951.49. It sits $32.74 below the 24h high of $1,021.92.
TradingView levels, captured at 8:10 UTC, add distance. Resistance at $1,118.59 stands 13.1% above price. The $863.52 support levels zone sits 12.7% below.
ZEC ETF Flows Turn Negative as Grayscale Sheds $14.61M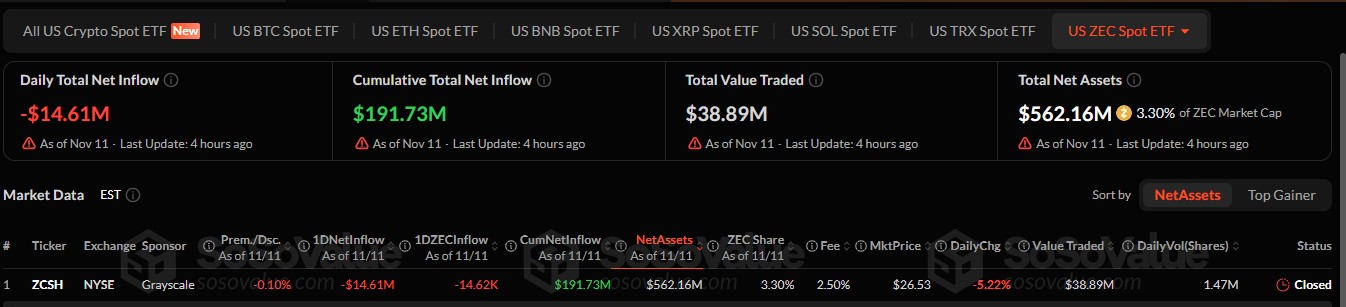
Per SoSoValue ETF data as of Nov 11, 2026, captured Nov 12, 2026, at 8:10 UTC, ETF flows show a daily net outflow of $14.61M. Grayscale's ZCSH drove all of it.
Source: SoSoValue, US $ZEC Spot ETF data as of Nov 11, 2026, captured Nov 12, 2026, 8:10 UTC
Cumulative net inflow still stands at $191.73M. ETF net assets, the total value of ZEC the fund holds, reached $562.16M, or 3.30% of market cap.
Outflows can force a fund to sell $ZEC to meet redemptions, which adds sell pressure. Earlier work on ZEC and ETF outflows adds context for days like this. A streak of negative ETF flows would weigh on price.
Zcash Price Forecast Risk: Whale Wallets Hold 23.5%
The ZecBlock rich list, captured at 8:10 UTC, shows the top ten transparent addresses hold 2.83M $ZEC, or 23.5%.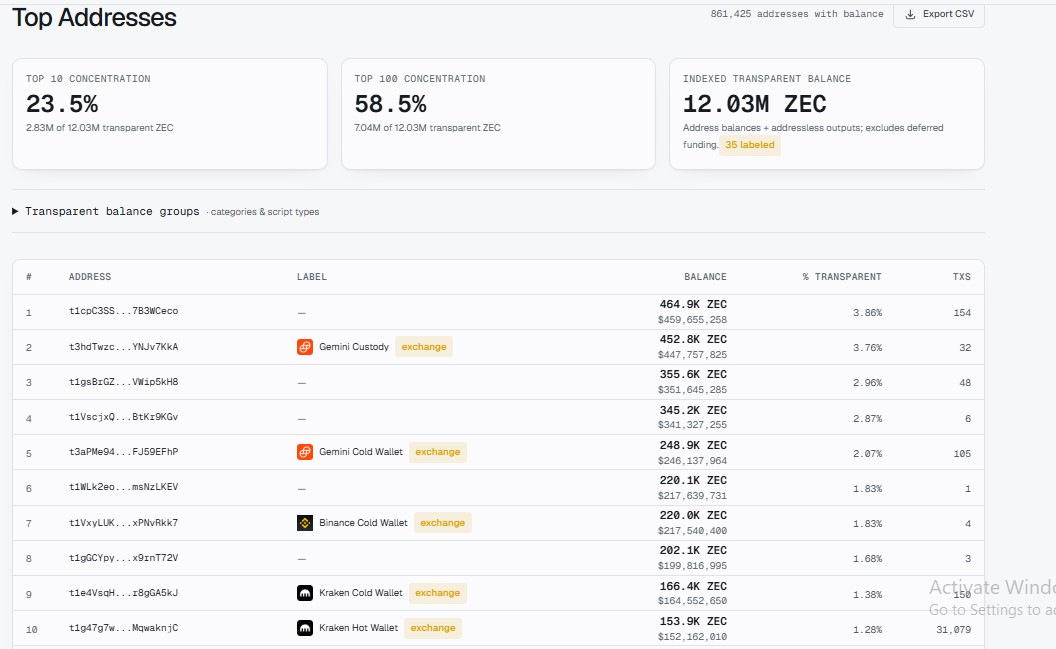
Source: ZecBlock, $ZEC holders list, captured Nov 12, 2026, 8:10 UTC
Coins in exchange wallets can reach the order book fast, so one large sale can push the price lower.
ZEC Liquidation Data: Longs Lose $4.18M in 12h
CoinGlass liquidation data, captured at 8:10 UTC, shows $11.98M wiped out in 24h. Longs lost $6.94M, shorts $5.04M.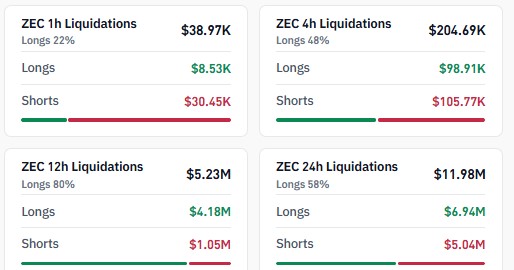
Source: CoinGlass, ZEC liquidations, captured Nov 12, 2026, 8:10 UTC
Over the last 12 hours, Longs took $4.18M of the $5.23M total. The pace then slowed. The last 1 hour hit shorts hardest at $30.45K.
A liquidation is a forced exit when margin runs out. Long liquidations add sell orders and can push the price lower.
ZEC Open Interest Hits $2.15B: Futures Data
Open interest, the total value of futures contracts still open, reached $2.15B in the 24h CoinGlass futures data, captured at 8:10 UTC. Binance shows $490.79M open interest, up 3.3%.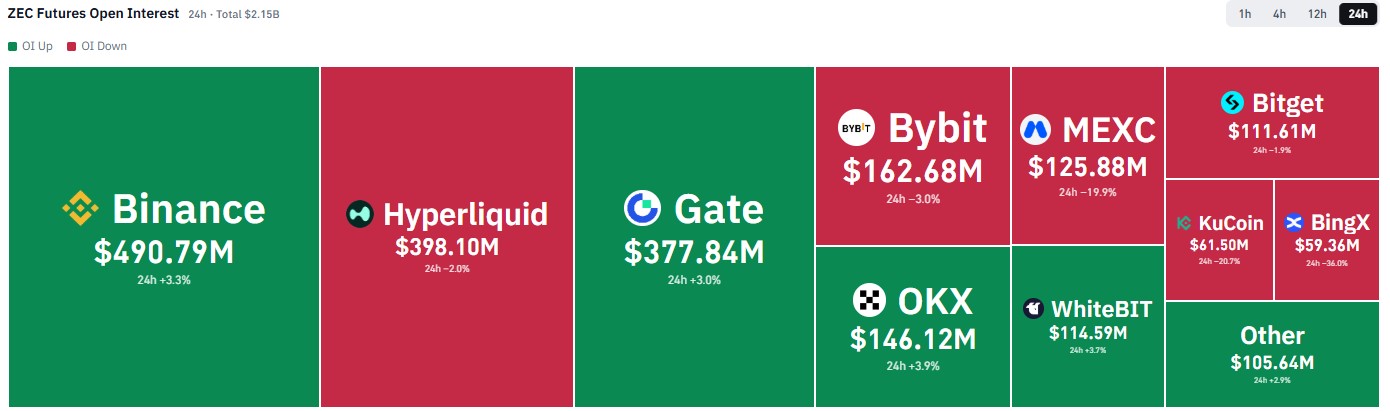
Source: CoinGlass, $ZEC futures open interest, 24h, captured Nov 12, 2026, 8:10 UTC
Hyperliquid shows at $398.10M, while BingX cut 36.0% open interest and MEXC 19.9% OI.
Rising open interest during a drop means traders are adding positions into weakness, which can fuel sharp moves.
Zcash Technical Analysis: 50-Day EMA and RSI Levels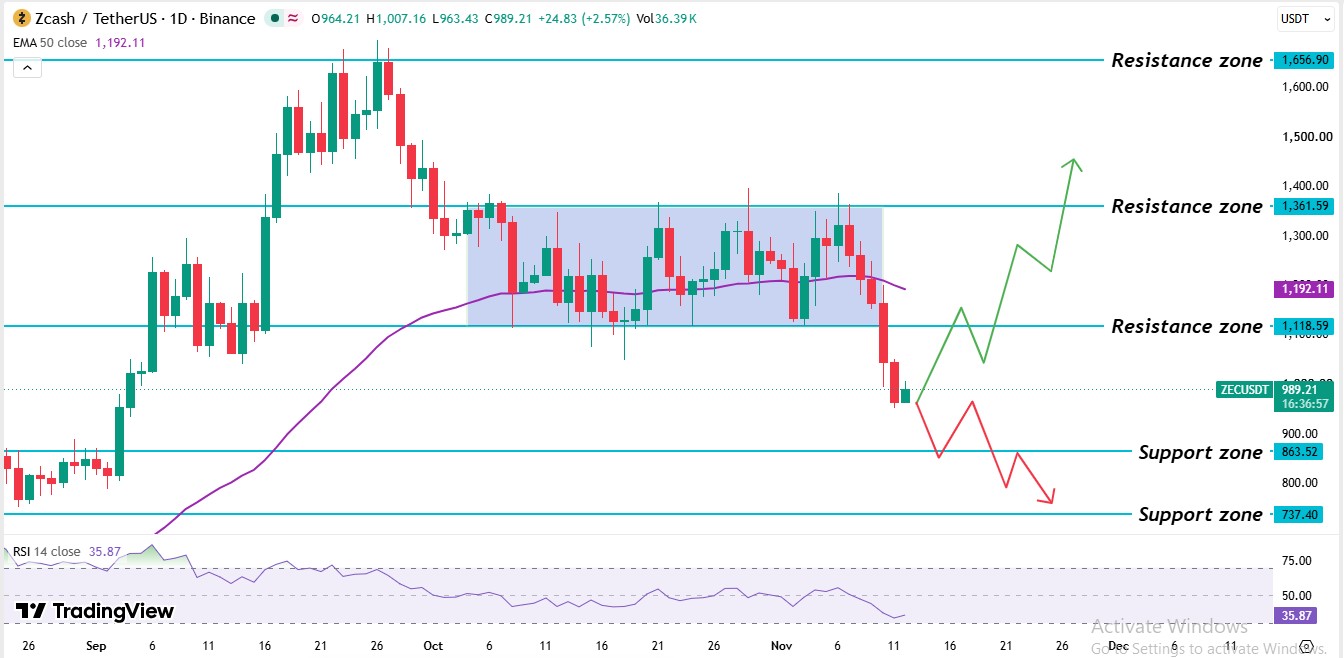
Source: TradingView, $ZEC/USDT daily chart with EMA 50 and RSI 14, captured Nov 12, 2026, 8:10 UTC
The Binance 1D chart for $ZEC/USDT frames this Zcash price prediction. A September rally pushed $ZEC up to $1,656.90 before sellers took control.
$ZEC then moved sideways in a range, a band held between a support level at $1,118.59 and a resistance level at $1,361.59. Buyers tried many times to break the resistance level, but sellers defended it.
In early November, daily candles broke below the range and the $1,192.11 50-day EMA level, an average of the last 50 daily prices. Traders tracking the latest crypto market news can compare it with this chart, but these levels decide the setup. That break turned the $1,118.59 support level into a resistance level.
Right now, $ZEC trades below $1,118.59 and the 50 EMA level but above the $863.52 support zone.
The $ZEC 50-day EMA sits at $1,192.11. ZEC's $989.21 price trades 17.0% below it, and the latest daily candle trades below it too, so a real recovery needs a candle trading above it.
The $ZEC RSI reads 35.87 on the 14-day setting. pushed well above 70 during the early-September rally. Under 50 means sellers hold the edge. Above 30 means oversold conditions haven't formed and the price has room to fall.
Zcash Support and Resistance Levels
| Level | Type |
| $1,656.90 | Resistance |
| $1,361.59 | Resistance |
| $1,192.11 | 50-day EMA |
| $1,118.59 | Resistance |
| $863.52 | Support |
| $737.40 | Support |
Support is where buyers defend price, and resistance is where sellers cap it. The nearest support levels and resistance levels are $863.52 and $1,118.59.
Zcash Price Forecast: Bull, Base, and Bear Scenarios
| Scenario | Trigger | Target | Invalidation |
| Bull | Daily candle trades above $1,118.59 | $1,192.11 EMA | Falls back below $1,118.59 |
| Base | Price stays between $863.52 and $1,118.59. | Sideways trade inside that range | Daily candle breaks either level. |
| Bear | Daily candle trades below $863.52 | $737.40 | Daily candle trades above $1,118.59 |
A regulatory delay would hit sentiment, and fresh ETF outflows after the $14.61M day would add sell pressure. The chart has its own trigger. A daily candle trading below $863.52 voids the base case.
Zcash Price Prediction: Expert Outlook
According to CoinGabbar analysis, Bears holds the edge in this Zcash price prediction. ZEC trades 17.0% below its 50-day EMA, and RSI at 35.87 shows oversold conditions haven't formed. But the $951.49 24h low was held, and shorts lost $30.45K in the last hour.
The condition to monitor is a daily candle trading above $1,118.59. That level is the old support level, and a hold above it puts the $1,192.11 EMA in play.
Disclaimer: This article is for information only and isn't financial advice. Traders should do their own research and risk only what they can afford to lose.
0
0

 Manage all your crypto, NFT and DeFi from one place
Securely connect the portfolio you’re using to start.


