
Chainlink Price Prediction: Can LINK Bounce After the Breakdown?

0
0

Did Chainlink just hand back the entire breakout in one session?
LINK trades near $12.17 at 09:20 UTC on October 22, 2026, down 1.87% in 24 hours. This Chainlink price prediction starts with a failed move, since yesterday's channel breakout call leaned on $12.467 holding.
Buyers did reach $12.79. But that high is gone.
Yesterday's Prediction: Target vs. Actual Result
The timeframe runs from 06:00 UTC on October 21 to 09:20 UTC on October 22, 2026.
Yesterday's Level | Actual Result | Status |
Trade above $12.467 | High of $12.79 | Hit |
Reach $13.033, then $13.497 | Peak near $12.81 | Not Hit |
Drop under $12.147 (fake breakout) | Trades near $12.03 | Hit |
Slide to $11.849, then $11.534 | Trades above $12.02 | Not Hit |
Final status: Partially Hit. Bulls cleared $12.467, but the breakout didn't survive.
$LINK Price Today: Market Snapshot
Current Price and 24H Performance
The $LINK price today is $12.17 on CoinMarketCap $LINK data, down 1.87% with a 24-hour range of $12.17 to $12.79. Binance LINK/USDT trades at $12.031 on the 30-minute chart.
Trading Volume and Market Cap
Volume reached $268.4M, up 11.44%, against a market cap of $9.1B. Circulating supply is 748.09M of 1B LINK. Rising volume on red candles points to sellers.
Why Is Chainlink Falling Today?
Breaking: LINK slips out of its ascending channel.
Price trades below all four EMAs. Longs lost $1.25M in 24 hours. ETF flow? Zero. Sellers hold control.
Chainlink News: Q3 Momentum Recap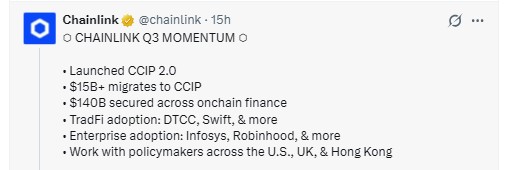
Chainlink's Q3 momentum recap lists CCIP 2.0, $15B+ migrating to CCIP, and $140B secured across on-chain finance. Price shrugged anyway.
Link: NYC Catalyst on October 29
Co-founder Sergey Nazarov delivers the Link: NYC keynote post on October 29, 2026, alongside DTCC, the CFTC, Swift, ICE, and Fidelity.
That's a possible spark for Chainlink news flow, not a promise.
Chainlink Technical Analysis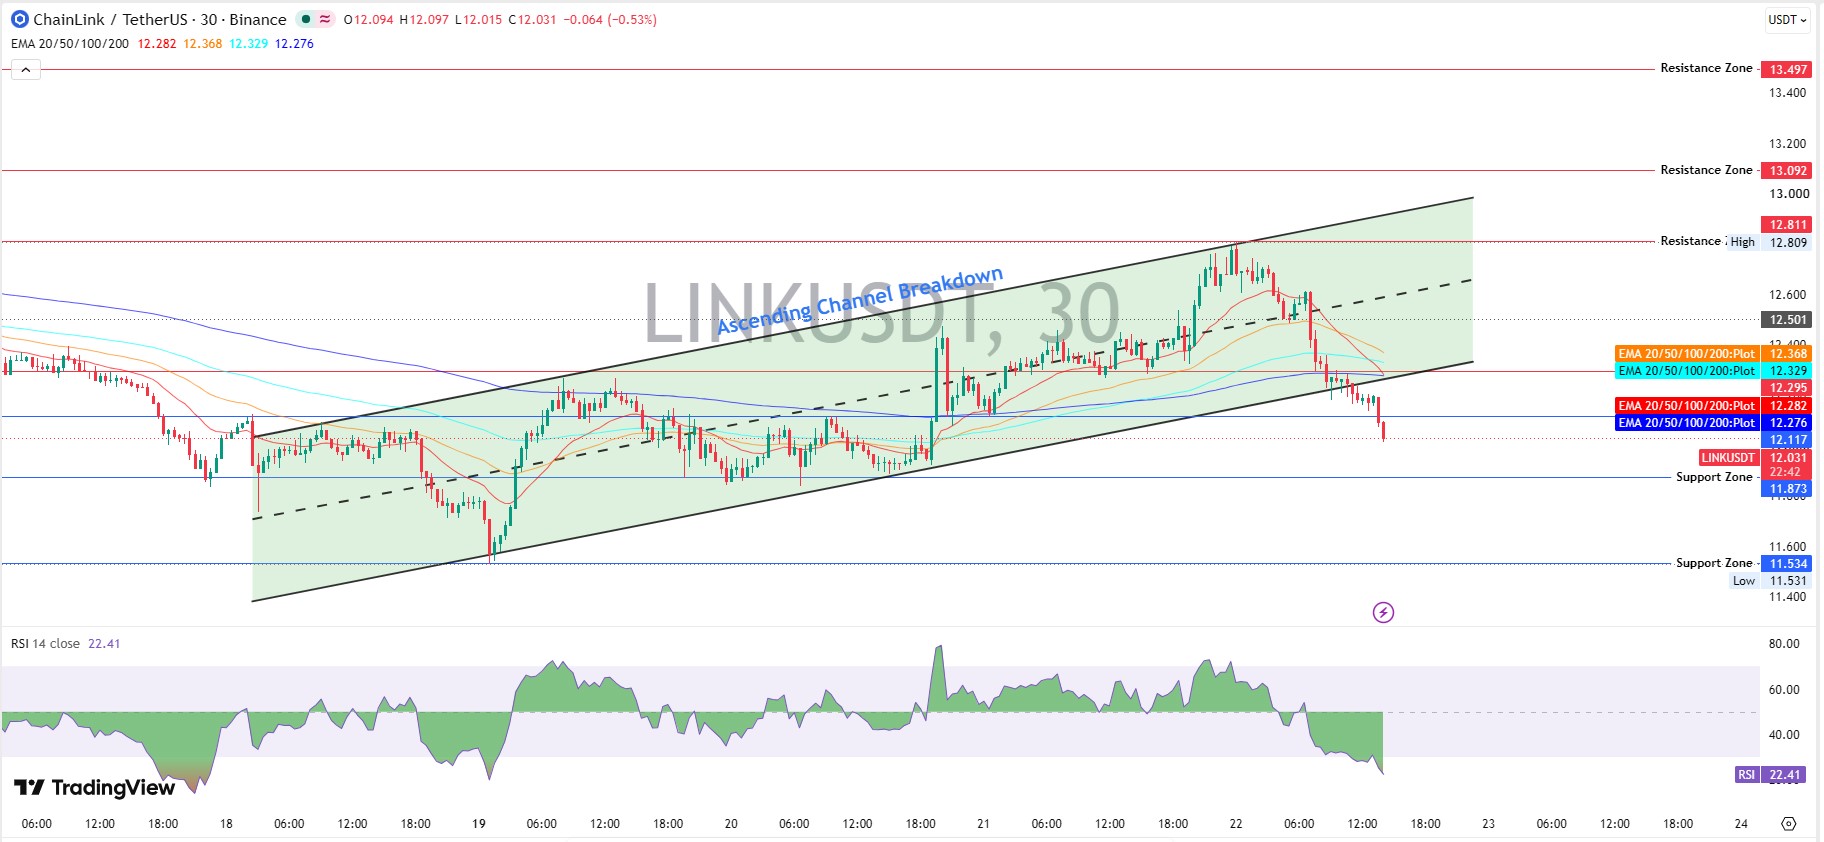
On the TradingView 30-minute chart, $LINK climbed inside two rising lines since October 18. Then that channel snapped near $12.809.
An EMA is a moving average that weights recent trades more. Here the 20 EMA sits at $12.282, the 50 EMA at $12.368, the 100 EMA at $12.329, and the 200 EMA at $12.276, all above price.
Chainlink technical analysis reads bearish while the price stays under that stack.
Will Chainlink Price Go Up Today?
RSI reads 22.41. Below 30 means oversold, so a bounce feels due.
Then again, due isn't a signal. An earlier reserve buy bounce shows oversold dips can reverse, though a $LINK price prediction for a pump needs volume first.
Key Support Levels
$LINK support and resistance starts with floors. First sits $11.873, about 2.4% below spot, then $11.534 near the $11.531 low. That second floor echoes the CPI selloff support test.
Key Resistance Levels
Overhead, the EMA cluster from $12.276 to $12.368 caps rebounds. Next come $12.811, $13.092, and $13.497. The NYC channel test showed how stubborn this zone gets.
Can $LINK Break Its Resistance?
It needs trades above $12.368 and a hold. Without volume above $268.4M, rallies fade.
Is Chainlink preparing for a breakout? Not yet.
Futures Positioning and Liquidations
Futures volume hit $404.87M. Spot managed $65.01M. Which tells where the leverage lives.
CoinGlass LINK data shows open interest at $584.34M and liquidations of $1.38M, mostly longs. So who's left to buy the dip?
Chainlink ETF Flows
SoSoValue LINK ETF data shows $0.00 net inflow on October 21, 2026.
Cumulative inflow holds at $179.23M. And the last outflow, $397.26K, came October 16.
Whale and Holder Snapshot
Etherscan holder data counts 916,540 holders. Whales, a tier of 4,147 wallets, control 90.67% of market cap.
The top 100 wallets hold 61.20%, though many are Chainlink's noncirculating supply.
Can Institutional Adoption Push $LINK Higher?
It can, slowly. DTCC news and ETF inflows built that case before.
But ETF net assets of $224.77M equal 2.37% of market cap. Small for now.
Is Chainlink Undervalued Right Now?
At $12.17, $LINK sits 76.98% below its $52.88 high from May 10, 2021. Cheap versus history isn't the same as undervalued.
Fully diluted value is $12.17B, and the community pool in this LINK staking news update holds 4.0876% of supply.
Is LINK a Buy or Sell Today?
Bias stays bearish below $12.368. And that's a chart read, not a trade order.
Chainlink Price Prediction Scenarios
Scenario | Trigger | Target | Invalidation | Liquidity Condition |
Bull | Trades and holds above $12.368 | $12.811, then $13.092 | Trades below $12.031 | Volume above $268.4M, ETF inflows return |
Base | Chops between $11.873 and $12.368 | Same range | Break of either edge | Volume near $268.4M, ETF flow flat |
Bear | Trades below $11.873 | $11.534 | Reclaims $12.276 | Thin spot volume, long liquidations above $1.38M |
Chainlink Price Forecast by Timeframe
Next 24 Hours
The base case favors $11.873 to $12.368 until 09:20 UTC on October 23, 2026.
Next 7 Days
Reclaiming $12.368 opens $12.811, while losing $11.873 reopens $11.534. Link: NYC lands on October 29, 2026.
October 2026 Forecast
Month-end hinges on ETF demand, as the October 2026 forecast framed it.
Chainlink Price Target: Can Chainlink Reach $20, $30, or $50?
Can Chainlink reach $20? That needs +64.3% and a $14.96B market cap. A Chainlink price target of $30 needs $22.44B, and $50 needs $37.40B.
Two catalysts matter most: CCIP growth, per CCIP vault adapters, and ETF demand returning.
Risks That Could Change the Chainlink Price Prediction
A drop under $11.873, thin volume, stalled ETF demand, or whale selling would deepen the slide. And a reclaim of $12.368 would flip the bias.
Final Takeaway
Bearish near term. Bounce is possible; the trend is not yet repaired. Watch $12.368 above and $11.873 below.
Disclaimer: This Chainlink price prediction is for information only and isn't financial advice. Crypto prices swing fast, and scenarios aren't guarantees. Research independently before any trade.
0
0


 Manage all your crypto, NFT and DeFi from one place
Securely connect the portfolio you’re using to start.


