
Algorand Price Prediction November 2026: Trendline Breakout?

0
0
Can ALGO turn a daily jump into a real trend change?
This Algorand price prediction November 2026 report weighs price against a 50-day average and fresh futures data. It builds on the previous Algorand resistance test.
Market Snapshot Behind the ALGO Price Forecast
CoinGecko market data as of Nov 5, 2026, 04:52 UTC shows $ALGO at $0.1001, up 9.44% in 24 hours. Its $908.883M market cap, ranks 77th.
Metric | Value |
ALGO price | $0.1001 |
24h change | +9.44% |
24h range | $0.09146 to $0.1007 |
Market cap | $908.883M |
FDV | $908.883M |
24h trading volume | $45.75M |
Circulating supply | 9.077B |
Max supply | 10B |
Source: CoinGecko, $ALGO market snapshot, Nov 5, 2026, 04:52 UTC
Price Performance Puts ALGO Support Levels in Focus
CoinGlass price performance data as of Nov 5, 2026, 04:52 UTC, shows ALGO down 3.74% in the week and 21.64% in the month. Those moves imply $0.1040 a week ago and $0.1277 a month ago.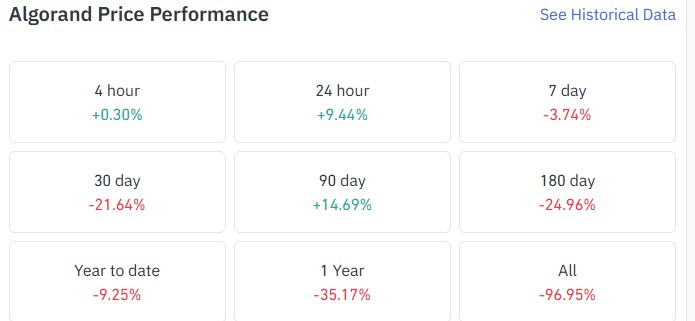
Source: CoinGlass, $ALGO price performance, Nov 5, 2026, 04:52 UTC
A 0.30% gain over 4 hours reads tired. On second thought, that's a pause after a 9.44% day on the same panel.
The 24h range runs from $0.09146 to $0.1007. Price trades 0.6% below that top and 9.4% above the floor.
Support, a price floor where buyers step in, sits at $0.0859. Resistance, a ceiling where sellers step in, sits at $0.1030.
ALGO Open Interest and Futures Volume by Exchanges
Open interest is the total value of futures contracts still open. CoinGlass open interest data shows $49.00M on Nov 5, 2026.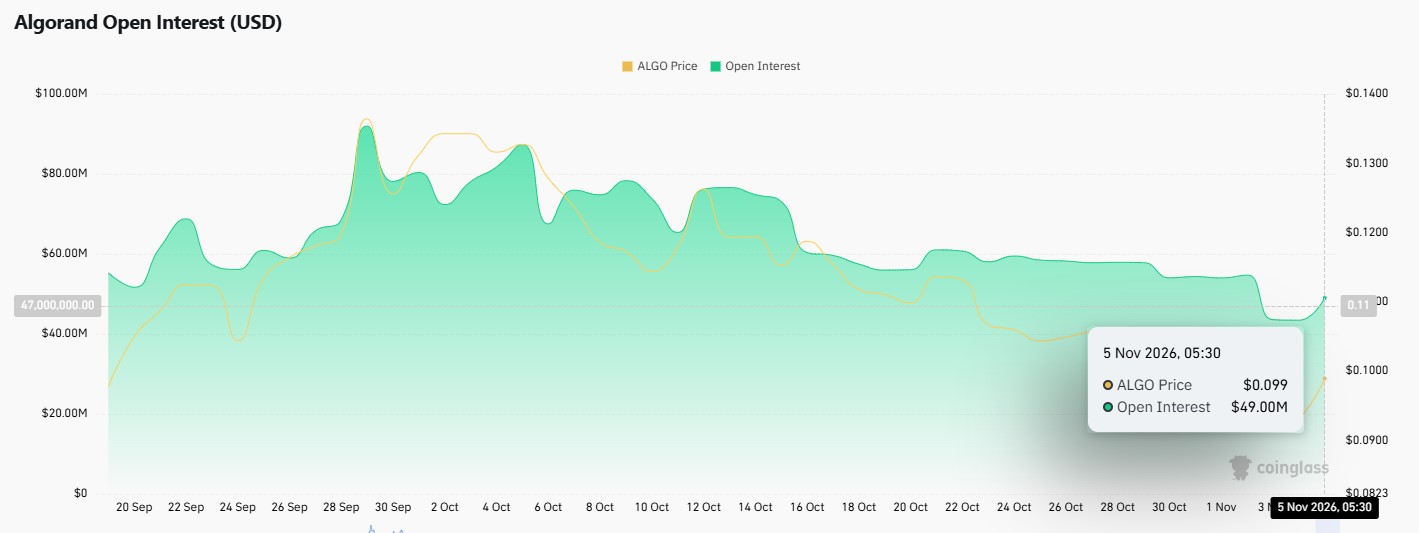
Source: CoinGlass Open Interest, Sep 20 to Nov 5, 2026, 04:52 UTC
$ALGO open interest sits about 47% below the roughly $92M peak near Sep 29, 2026.
CoinGlass futures volume puts Binance at $16.80M and OKX at $8.40M, as of Nov 5, 2026, 04:52 UTC.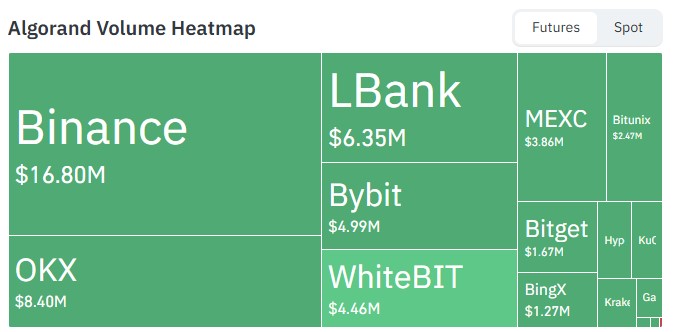
Source: CoinGlass, $ALGO futures volume heatmap, Nov 5, 2026, 04:52 UTC
Binance alone holds 33.4% of the $50.27M traded volume across the nine exchanges. LBank follows at $6.35M, ahead of Bybit at $4.99M.
Algorand Technical Analysis: 50-Day EMA and RSI Levels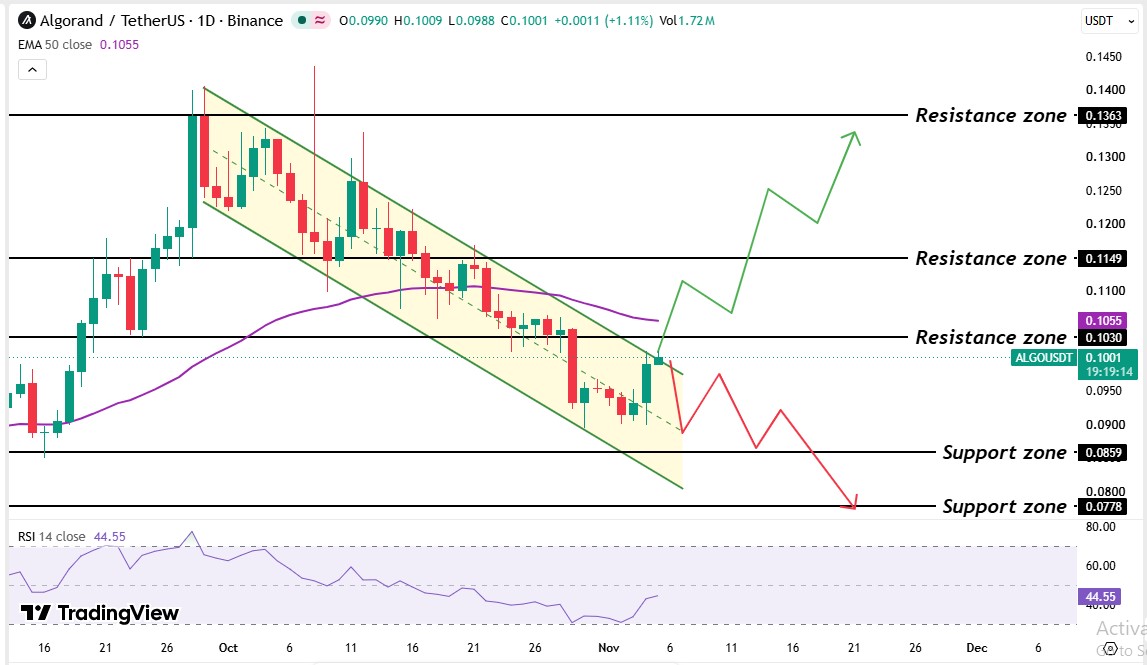
Source: TradingView, ALGO/USDT 1D, Nov 5, 2026, 04:41 UTC
The Binance 1D chart for $ALGO/USDT on TradingView frames this Algorand price prediction. A sharp September rally spiked above the $0.1363 resistance level before sellers took control.
After rejecting the $0.1363 level, the price started going down by making lower highs and lower lows and formed a descending channel.
The market tried many times to break the upper line of the channel, but sellers defended the trendline. Price then slipped under the $0.1055, 50 EMA level, where sellers have stepped in, and slid toward the $0.09 area.
Buyers pushed back there, and a green candle lifted ALGO to the upper trendline of the channel. Right now, ALGO trades at the channel upper trendline, above the $0.0859 support zone and below the 50 EMA.
The $ALGO 50-day EMA sits at the $0.1055 level. ALGO's $0.1001 price trades 5.1% below it, and the latest daily candle trades below it too.
Price sits above the channel trendline, so a real recovery needs a break of both levels.
The $ALGO RSI reads 44.55 on the 14-day setting. It rose above 70 in the late-September rally.
A reading under 50 means sellers hold the momentum edge. And above 30 means selling hasn't gone too far, so oversold conditions haven't formed and price has room to fall.
Algorand Support and Resistance Levels
Level | Type |
$0.1363 | Resistance |
$0.1149 | Resistance |
$0.1055 | 50-day EMA |
$0.1030 | Resistance |
$0.0859 | Support |
$0.0778 | Support |
ALGO resistance levels start at $0.1030, and ALGO support levels start at $0.0859. Both work as zones, so price can pierce them briefly.
Algorand Bull, Base, and Bear Scenarios
Scenario | Trigger | Target | Invalidation |
Bull | Daily candle above the trendline and $0.1055 level | $0.1149, then $0.1363 | Daily candle trades under $0.1030 |
Base | ALGO ranges under the $0.0859 to $0.1055 | Sideways inside the range | Daily candle trades outside that range |
Bear | Trendline rejection, then a daily candle under the $0.09146 level | $0.0859, then $0.0778 | Daily candle trades above $0.1055 |
In the bull case, a daily candle trades above the falling trendline and the $0.1055 EMA, which opens $0.1149. The base case has $ALGO ranging under the 50 EMA between the $0.0859 and $0.1055 levels.
For this Algorand price prediction November 2026, the bear case needs a rejection at the falling trendline, then a daily candle under $0.09146. That path targets $0.0859, then $0.0778.
Technical invalidation is the main risk, since a failed trendline break sends price toward $0.0859. Thin-futures activity can turn small orders into fast moves.
Expert Outlook on Algorand Price Prediction November 2026
As per CoinGabbar analysis, this Algorand price prediction November 2026 leans bearish while $ALGO trades below the $0.1055 EMA level. The case rests on a 5.1% gap to the EMA and an RSI of 44.55.
Price gains a 9.6% in 24 hours, but the ALGO price forecast stays tied to that EMA. A daily candle above $0.1055 with open interest past $49.00M would turn the view bullish.
YMYL Disclaimer: This article is for educational and informational purposes only. It does not offer financial advice, price guarantees, or return promises. Crypto assets are volatile, so readers should research independently before making decisions.
0
0

 Manage all your crypto, NFT and DeFi from one place
Securely connect the portfolio you’re using to start.


