
Best Crypto to Buy Now: Bitcoin Slips Below $73K as Four Majors Hit 30-Day Lows

0
0

Bitcoin traded at $72,809 at 12:15 UTC on November 12, Ethereum at $2,019.17, Solana at $82.30 and Hyperliquid at $70.60. On CoinGecko’s 30-day series, every one of those quotes is the lowest point of its own window, printed within the same hour of the same morning.
A $1,000 position opened in any of the four on October 14 is worth between $771 and $876 today. That is the first thing to understand about the question readers keep asking: the past month has not rewarded a story, it has repriced everything. What the tape still offers is arithmetic, namely how much new capital a recovery would have to attract, where the exits are thinnest, and which dated events sit inside the next three weeks.
The answer to “what should I buy” depends on what you are buying for, and this article does not advise anyone to buy anything. What it does is price the four largest liquid assets against each other at the same timestamp and show what a 2x or a 10x would actually require.
Four majors, one 30-day low
The whole crypto market was worth $2.416 trillion at the same timestamp, with Bitcoin at 60.5% of it and Ethereum at 10.19%. Every asset in the table below is trading below every earlier point in its own 30-day CoinGecko series, so the usual crutch of “buy the dip relative to last week” has nothing to lean on: there is no higher low yet.
| Asset | Price, 12:15 UTC | 24h | 7d | Market cap | 24h volume |
|---|---|---|---|---|---|
| BTC | $72,809.00 | -1.45% | -9.19% | $1.464 trillion | $23.24 billion |
| ETH | $2,019.17 | -1.69% | -16.40% | $246.66 billion | $8.55 billion |
| SOL | $82.30 | -1.76% | -14.66% | $48.65 billion | $1.83 billion |
| HYPE | $70.60 | -2.26% | -14.07% | $16.90 billion | $805.14 million |
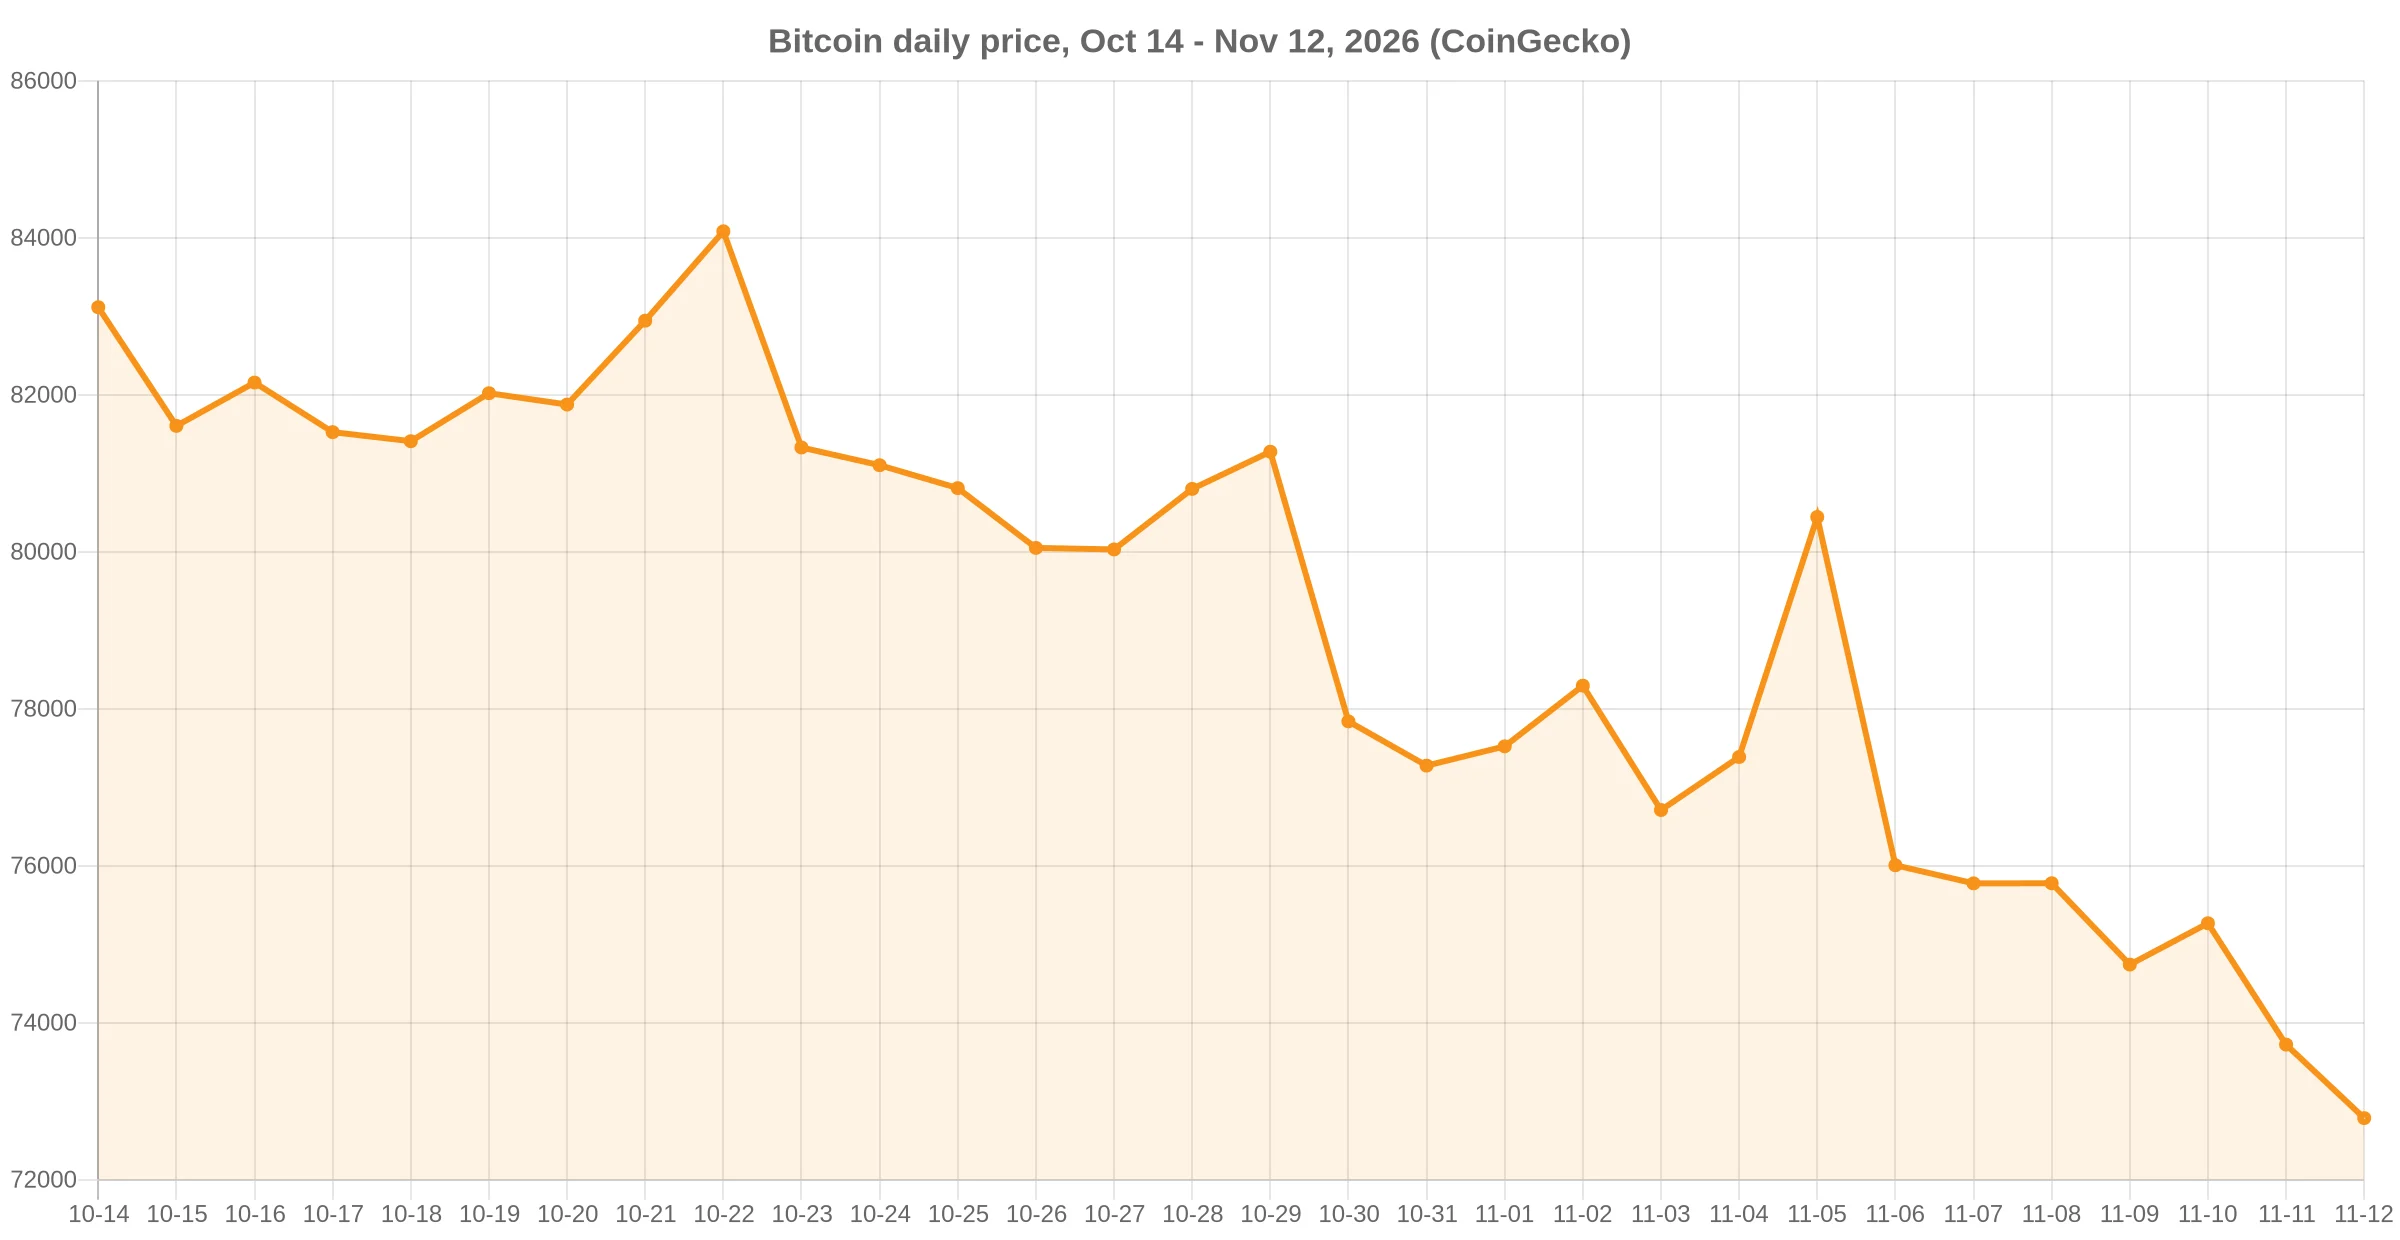
The 30-day bands tell the same story from the other side. Bitcoin’s range is $72,784 to $84,082, a 15.5% spread, against 23.7% for Ethereum, 30.0% for Solana and 27.4% for Hyperliquid. Bitcoin has lost the least in percentage terms, which is what usually happens when leverage, rather than a single protocol, is being unwound. The clearest evidence sits in the flow record: the seven sessions through November 9 produced $2.13 billion of net redemptions across US spot Bitcoin funds, with BlackRock’s IBIT accounting for $1.66 billion, or 77.9%, as BlockchainReporter reported at the time. Nothing in the price data establishes that flows caused the decline, and the sequence of events alone cannot prove it.
What $1,000 buys today, and what it bought on October 14
Unit counts are the honest way to compare entries, because they strip out the dollar sign and show how much of each network’s asset a fixed sum commands right now.
At the 12:15 UTC quotes, $1,000 buys 0.013735 BTC, 0.495253 ETH, 12.1507 SOL or 14.1643 HYPE. The same $1,000 spent on October 14, when Bitcoin traded at $83,115.10, Ethereum at $2,496.59, Solana at $106.75 and Hyperliquid at $81.53, would now be worth $876, $809, $771 and $866 respectively: a loss of 12.4% for Bitcoin, 19.1% for Ethereum, 22.9% for Solana and 13.4% for Hyperliquid.
The dispersion matters more than the headline. Solana has lost nearly twice what Bitcoin has over the month, and Ethereum has lost more than either Hyperliquid or Bitcoin. If you believe the drawdown is a liquidity event that ends when leverage finishes clearing, the assets that fell hardest are the ones with the most ground to recover; if you believe it is a repricing of risk appetite, the ones that fell least are the ones the market still wants to own. Both readings fit today’s data, which is why the next section is about what a recovery would cost rather than what it would feel like.
The market-cap arithmetic behind a 2x and a 10x
Doubling a price is not a sentiment problem, it is a capital problem, and the sizes are not comparable across these four. Bitcoin would need to add $1.464 trillion of market value to double from $1.464 trillion to $2.928 trillion. Every other crypto asset in existence, added together, is worth about $951.89 billion today. Bitcoin’s 2x therefore requires net new value 1.54 times the size of the entire rest of the market.
Ethereum’s 2x is a $246.66 billion problem, or about 17% of Bitcoin’s current capitalisation. A tenfold Ethereum at $2.467 trillion would be 1.69 times Bitcoin’s market cap today. Solana at ten times today’s price is a $486.51 billion asset, which is 1.97 times Ethereum’s current size. Hyperliquid at ten times is $168.97 billion, or 3.47 times Solana’s market cap now.
Put the other way around: a 10x on Hyperliquid requires less absolute capital than a 2x on Ethereum ($168.97 billion against $493.32 billion), because the starting base is 14.6 times smaller. Small caps are cheaper to move and harder to exit, which is the trade every reader is actually making when they choose between these four.
Turnover shows where the exits are
Daily volume as a share of market cap is the simplest liquidity proxy available from public data, and it separates the four cleanly. Bitcoin turns over 1.59% of its market value a day, Ethereum 3.47%, Solana 3.77% and Hyperliquid 4.76%. In dollar terms Bitcoin still trades 29 times Hyperliquid’s daily volume.
Read that ratio the right way: the smaller assets change hands faster relative to their size, so a position of a given dollar size is a larger share of their daily liquidity. A $1 million order is 0.0043% of Bitcoin’s daily volume and 0.12% of Hyperliquid’s, a 29-fold difference in exit cost that no price chart shows. That is the argument for the boring asset when the market is falling, and the argument against it when the market is recovering.
The dated calendar for the next three weeks
Three scheduled events fall inside the window and all three are already on the record. Zcash coinholder polling opens on November 16 and runs to November 30, with a merged draft that would move 50,000 ZEC out of the grants treasury, as detailed here; the merged pull request is zcash/zips #1428. OKX’s European venue opens tokenised stock trading on November 23 with 70 assets, 59 of them Direxion ETFs, a date the exchange set itself. Strategy leaves the MSCI indexes on November 30, a mechanical change that affects index funds rather than the company’s bitcoin.
None of these is a price catalyst in any provable sense. They are dates on which a supply, a product or an ownership base changes, and dates are the only part of the next three weeks that can be verified in advance.
What would change the picture
The four references below come from the same CoinGecko 30-day series, which samples each day at the same hour rather than at a UTC midnight close. A daily point above the most recent one in the series would be the first evidence that the sequence of lower prices has stopped, and a point below today’s extends it. These are reference points, not forecasts, and none of them is a target.
- Bitcoin: today’s point is $72,784, below the $73,721 of November 11; the November 6 point was $76,006, and getting back above it would break the run of lower prints.
- Ethereum: today’s point is $2,019, below the $2,050 of November 11; the November 6 point was $2,236.
- Solana: today’s point is $82, below the $83 of November 11; the November 6 point was $89.
- Hyperliquid: today’s point is $71, below the $72 of November 11; the November 6 point was $77.
The distinction between a new low and a failed low is the only technical information this data set can support. Everything else, whether the drawdown ends here, whether the ETF outflows reverse, whether the next three weeks produce a bid, is inference, and should be labelled as such.
Frequently Asked Questions
What is the best crypto to buy right now?
There is no single answer, and this article does not give investment advice. The four largest liquid assets were all at 30-day lows at 12:15 UTC on November 12: Bitcoin at $72,809, Ethereum at $2,019.17, Solana at $82.30 and Hyperliquid at $70.60. The choice between them is a choice between a $1.464 trillion asset that turns over 1.59% a day and a $16.90 billion asset that turns over 4.76%.
Is Bitcoin at a 30-day low?
Yes. On CoinGecko’s 30-day series the lowest point in the window is today’s, at $72,784, against a previous low of $73,721 on November 11. The 30-day range runs from that low to $84,082.
What would a Bitcoin 2x require in market-cap terms?
Bitcoin’s market cap was $1.464 trillion. Doubling the price doubles that to $2.928 trillion, so the move requires about $1.464 trillion of net new market value, which is 1.54 times the $951.89 billion that every other crypto asset is worth combined.
How much have Bitcoin, Ethereum, Solana and Hyperliquid fallen in 30 days?
From their October 14 prices to the 12:15 UTC quotes on November 12 they fell by 12.4%, 19.1%, 22.9% and 13.4%. The seven-day changes were -9.2%, -16.4%, -14.7% and -14.1%.
What events could move crypto prices before the end of November?
Three dated ones are already public: Zcash coinholder polling opens on November 16, OKX’s European venue starts tokenised stock trading on November 23, and MSCI removes Strategy from its indexes on November 30. None of them is guaranteed to move prices, and none should be treated as a signal on its own.
Data: CoinGecko price and market-cap pages for bitcoin, ethereum, solana and hyperliquid. All prices are CoinGecko quotes taken at 12:15 UTC on November 12, 2026 and will change; market-cap, volume and turnover figures derive from the same snapshot. The 30-day changes compare the October 14 daily point with the latest quote, and the level references use the same CoinGecko 30-day series, which samples each day at the same hour.
This article is not intended as financial advice. Educational purposes only. Prices cited are CoinGecko quotes taken at 12:15 UTC on November 12, 2026 and will change.
0
0


 Manage all your crypto, NFT and DeFi from one place
Securely connect the portfolio you’re using to start.
 Where will Bitcoin trade next?
Live Polymarket and Kalshi odds on Bitcoin price targets, compared side by side.
See Bitcoin price odds


