
Bitcoin Chart Analysis: Price, Key Levels and the Week Ahead

0
0

Bitcoin Chart Analysis Week 47/2026: Price drops below both averages and tests its 90-day low
Updated November 16, 2026. According to CoinGecko, Bitcoin traded at $64,389 on Monday afternoon, 13.8 percent below its level a week earlier.
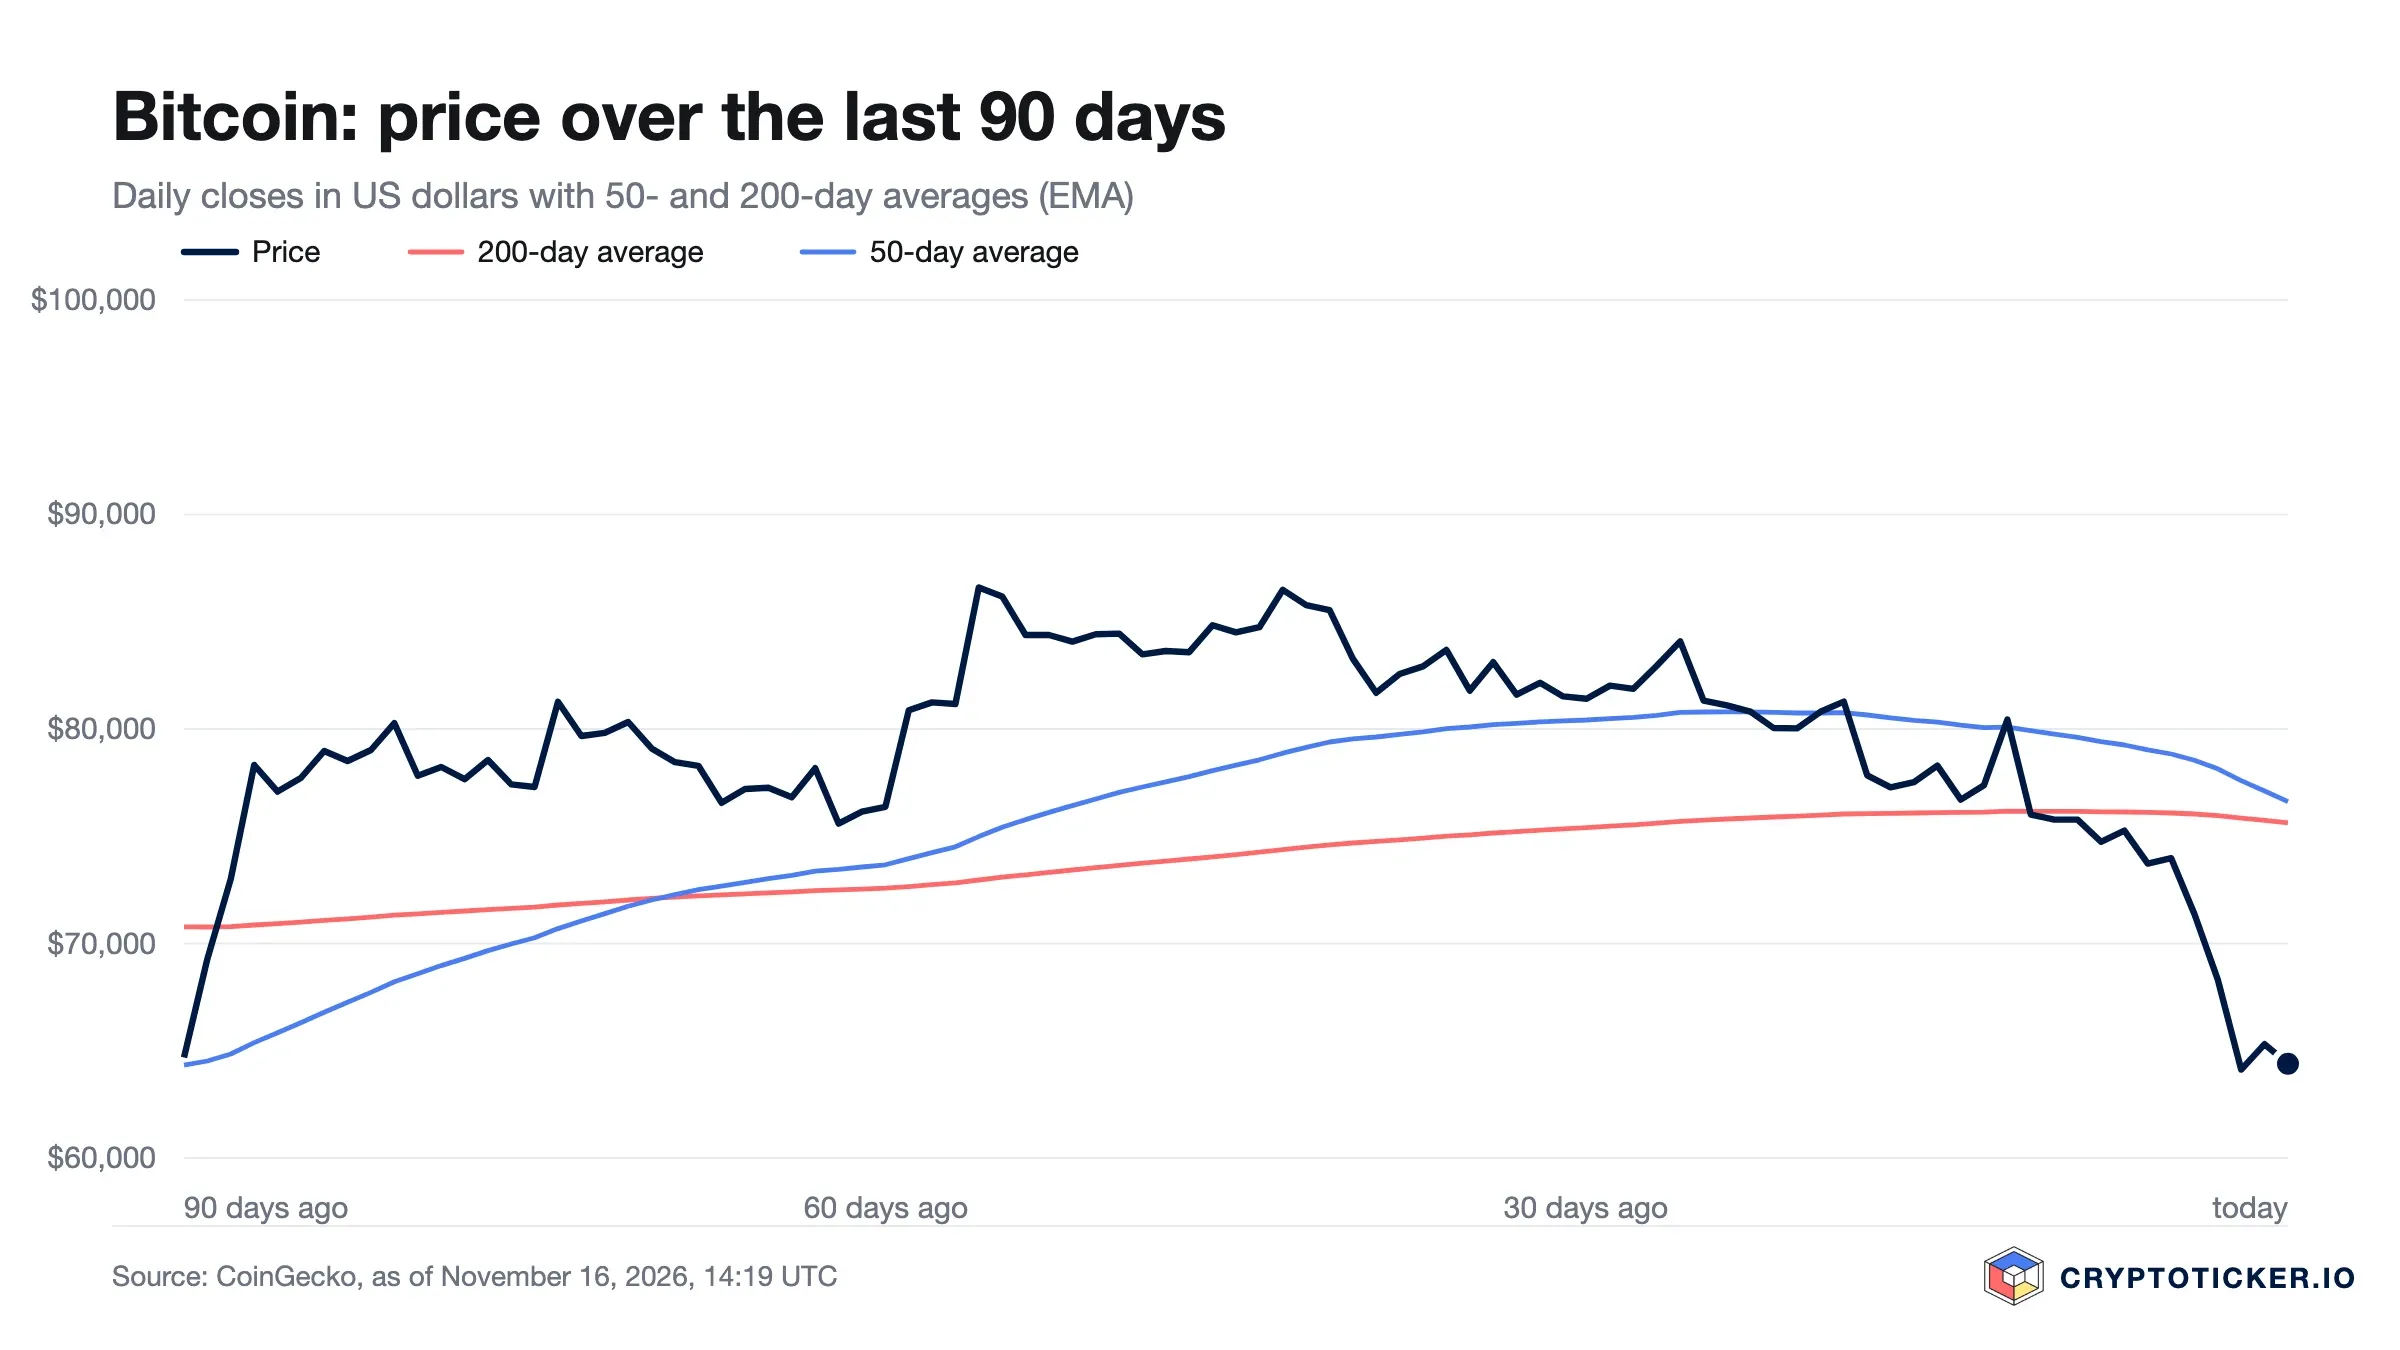
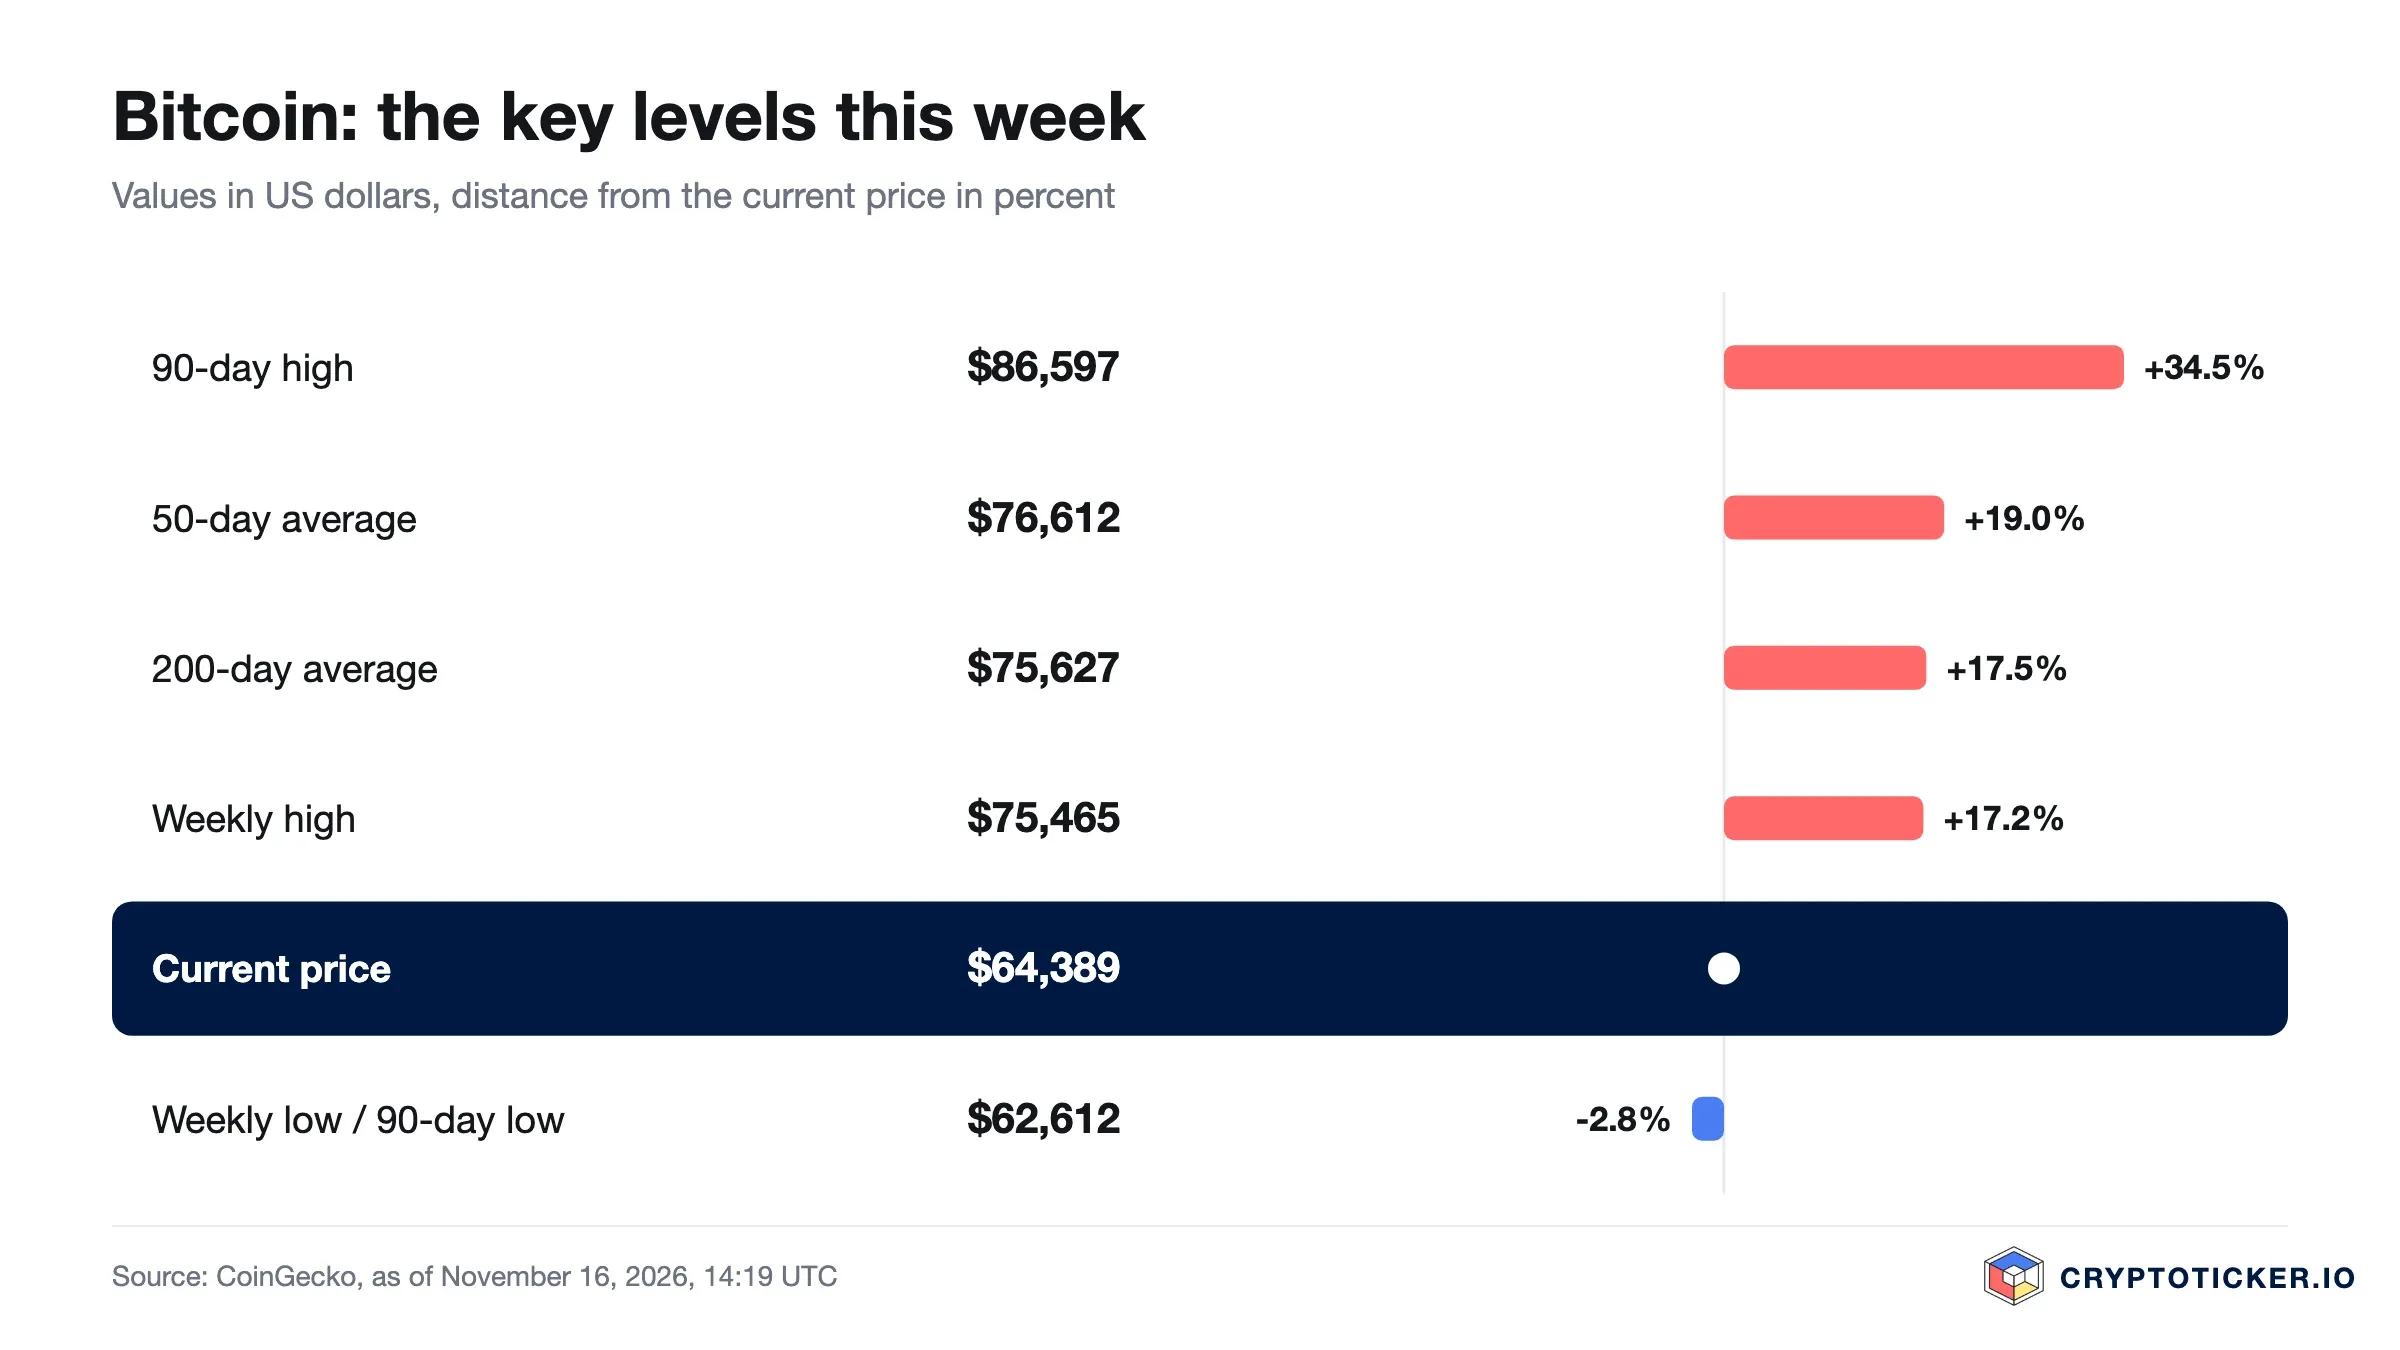
One week has turned the chart around. Last Monday Bitcoin still cost $74,659, just below the 200-day exponential moving average (EMA) that now stands at $75,627. Since then the price has fallen through both moving averages: the 50-day average at $76,612 now sits 19.0 percent above the price, the 200-day average 17.5 percent. The weekly low of $62,612 is also the lowest level of the past 90 days. The daily value last sat above the 200-day average on November 5.
The 50-day average is still slightly above the 200-day line, a golden cross that has held since September 9. Both lines are turning lower, however, and the gap between them has narrowed to about $1,000. If prices stay at this level, the shorter line could slip below the longer one within days. Chart analysts call that pattern a death cross.
Two levels matter this week. To the downside, the weekly low at $62,612 is the first support, about 2.8 percent below the current price; below it lies the lowest daily value of the past twelve months, $58,566 on July 1. To the upside, the weekly high at $75,465 is the first major hurdle, with the 200- and 50-day averages just above it between $75,600 and $76,600. Only a daily close above that band would break the downtrend.
The calendar adds weight: Nvidia reports quarterly results after the US close on Tuesday (Nvidia announcement), the Federal Reserve publishes the minutes of its October meeting on Wednesday at 2 p.m. ET, and Bitcoin options expire on Deribit on Friday morning. Our longer-term scenarios are in the Bitcoin price prediction.
How to read this Bitcoin chart analysis: trend, averages and key levels
This Bitcoin chart analysis follows the same rules every week, so the weeks can be compared with each other. It is based on daily closing prices from CoinGecko in US dollars over one year and on hourly prices for the past seven days. From these we calculate two moving averages and read off the levels where the price has recently turned.
- 200-day average: the long-term trend. Above it the market is considered intact, below it damaged.
- 50-day average: the medium-term trend. It reacts faster and shows whether a move has staying power.
- Weekly high and low: the range of the past seven days from hourly prices, often the first resistance and the first support.
- 90-day high and low: the range of a quarter, which larger buyers and sellers watch.
We use the exponential moving average (EMA), which gives more weight to recent prices than a simple average. When the 50-day average crosses above the 200-day average, chart analysts speak of a golden cross; when it crosses below, of a death cross. Both signals come late because averages follow the price. To trade Bitcoin, compare providers, fees and licences in our crypto exchange comparison.
Weekly Bitcoin chart analysis: what it can do and where it stops
Technical analysis describes where buyers and sellers last met. It does not predict what happens next. A level holds as long as enough market participants trade there. News such as a Federal Reserve decision, large flows into or out of the Bitcoin ETFs or a hack at a major exchange can override it within minutes. That is why this page shows levels and their distance from the price, but no price targets.
Every Monday a new section with the week's numbers is added at the top, and the key findings of earlier weeks stay listed below it. This shows at a glance how trend and levels have shifted from week to week. Charts and figures carry their timestamp.
If you trade on the back of this analysis, choose an exchange licensed under the EU's MiCA regulation. Which providers hold a licence and what they charge is shown in our comparison of regulated crypto exchanges. Cryptocurrencies are highly volatile, and this page is not investment advice.
0
0

 Manage all your crypto, NFT and DeFi from one place
Securely connect the portfolio you’re using to start.
 Where will Bitcoin trade next?
Live Polymarket and Kalshi odds on Bitcoin price targets, compared side by side.
See Bitcoin price odds


