
Can XRP Price Reach $10? Here Is What the Math Says

0
0
$10 XRP is one of the most searched price targets in crypto, and right now it looks further away than it did a year ago. XRP trades at $1.42 on October 7, 2026, down 4.7% on the day after slipping below the $1.50 level it had defended for two weeks. It is down 22.5% year to date, while Bitcoin is down less than 5%.
That has not stopped the forecasts. Banks, research desks, chart analysts and even AI chatbots have put $10 on the table, some for 2026, some for 2030. In this article we look at who is claiming what, read the current and historical XRP charts, and run the one calculation most of these forecasts skip: what $10 would mean for XRP's market cap, and whether that number makes sense. You can follow the live XRP price on our prices page.
Who Says XRP Can Reach $10 or More?
The $10 forecasts come from very different places, and the dates attached to them range from this December to 2041. Here is what is actually out there.
| Source | Target | Timeline | Reasoning given |
|---|---|---|---|
| Standard Chartered | $10.40, then $12.50 | 2027, 2028 | Institutional adoption, ETF demand, regulatory clarity |
| Standard Chartered (2030 case) | $28 | 2030 | XRP used in financial infrastructure; implies a cap above Bitcoin's today |
| Ryan Lee, Bitget Research | $10 | 2030 | RLUSD stablecoin adoption, possible Ripple IPO |
| Valhil Capital | "Over $10" | No date | XRP replaces pre-funded nostro/vostro accounts at global banks |
| Chart analysts (CoinGabbar) | $10.36 | Mid-2026 to early 2027 | Cup-and-handle pattern, double 201% Fibonacci extension |
| Grok (xAI chatbot) | $10 | End of 2026 | An edited image; Grok itself later called it a fun hypothetical |
| CoinCodex algorithm | $10 | October 2041 | Trend extrapolation |
Three things stand out. First, the serious institutional calls (Standard Chartered, Bitget) all sit in 2027 to 2030, not 2026. Second, the near-term $10 calls rest on chart patterns or on a chatbot meme, and the chart-based one assumed a $3.40 breakout that has not happened. Third, even the bullish 247 Wall St piece that walks through the 2030 scenarios concedes that $10 needs proof of real demand from XRP Ledger activity, not just another bull market. And when Yahoo asked ChatGPT about the Grok call in January, it gave $10 in 2026 an 18% probability and called it an extreme bull case.
XRP Price Today: What Does the Chart Say?
$XRP opened Tuesday at $1.497, sold off sharply around 05:00 UTC to $1.45, and then ground lower for the rest of the session to a low of $1.413 before a small bounce to $1.426. That is a 4.72% daily loss and a clean break below the $1.50 line that had capped and then supported price since the August breakout.
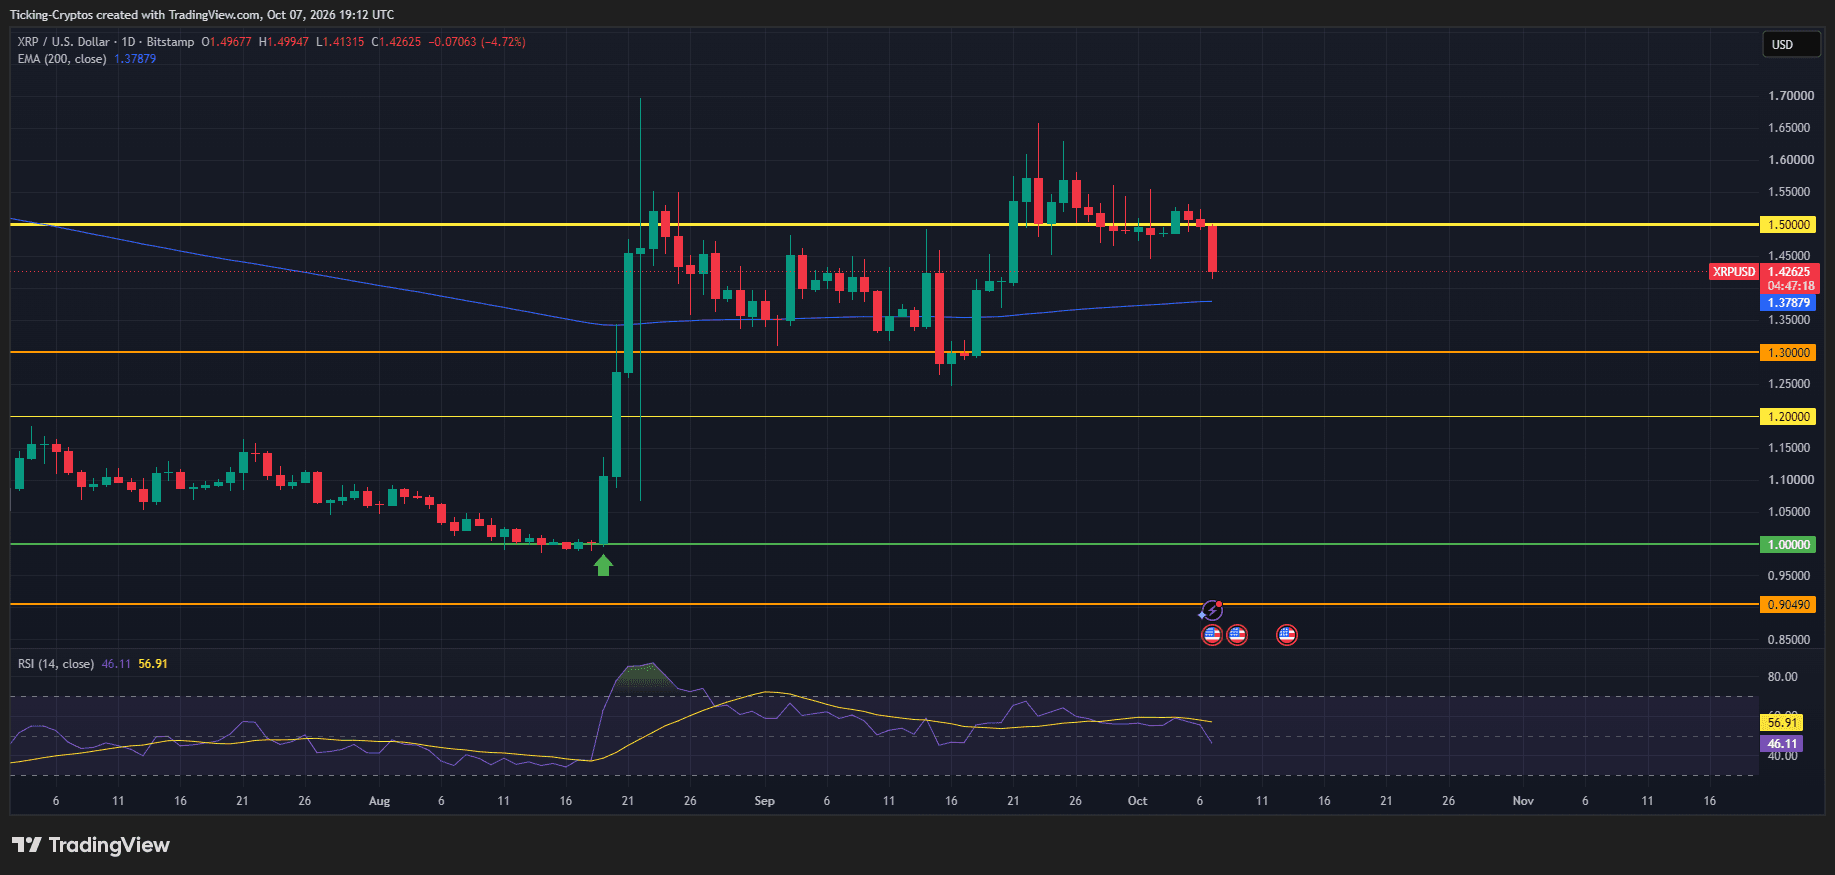
The key levels on the daily chart:
- $1.50: former support, now resistance. Price held above it from September 21 to October 6 and lost it today.
- $1.55 to $1.65: the late-September swing highs. A reclaim of this zone is needed before anyone can talk about $2 again.
- $1.38: the 200-day EMA, currently flat to slightly rising. This is the first real test below. XRP has bounced off this average twice since August, around August 29 and September 11.
- $1.30: horizontal support from the September 16 low, where the last 200-EMA break was bought back within a day.
- $1.20 and $1.00: the August base. The entire move from $1.00 to $1.50 happened in two candles on August 19 and 20, which means there is very little traded volume between those levels to act as support.
- $0.90: the deeper support line sitting under the August lows.
Momentum has turned too. The 14-day RSI dropped from the high 50s to 46, back below its signal line and below the neutral 50 mark for the first time since mid-September. There is no oversold reading yet, so there is room for further downside before a relief bounce becomes statistically likely.
The structure since August is a wide range between $1.30 and $1.65. Today's candle pushes price back into the middle of that range. The 200 EMA at $1.38 decides what comes next: a hold there keeps the range intact, a daily close below $1.30 opens the $1.20 to $1.00 gap. Nothing on this chart points at $10, or at $3 for that matter, in the near term.
XRP All Time High: What Does History Tell Us?
XRP has had three major cycles, and each one tells us something about how far this coin can run and how long it stays down afterwards.
- 2017 to 2018. XRP traded below $0.01 for years, then went vertical in the final months of 2017. The all time high of about $3.84 came in January 2018. The monthly closing high was closer to $2.00, which shows how much of that peak was a single wick. XRP then spent six years below that level and bottomed near $0.15 in March 2020.
- 2021. The next cycle peaked at roughly $1.96 in April 2021, a lower high, and this during a period when the SEC lawsuit kept XRP off most US exchanges. Price fell back to around $0.30 by 2022 and flatlined near $0.50 through 2023 and most of 2024.
- 2024 to 2025. The election-driven rally in November 2024 took XRP from $0.50 to $3.00 in roughly two months. A second push in July 2025 reached about $3.66, just shy of the 2018 record. That was the first time XRP had retested its all time high since 2018, and it failed to break it.
From the July 2025 peak, XRP has fallen more than 60%, touching $1.00 in August 2026 before the current bounce to $1.42. This is the fourth drawdown of more than 60% in XRP's history. Bulls point out that the previous three were each followed by rallies of around 1,000%. Bears point out that XRP has never set a new all time high in eight years and that the 2025 attempt failed at the same price zone as 2018.
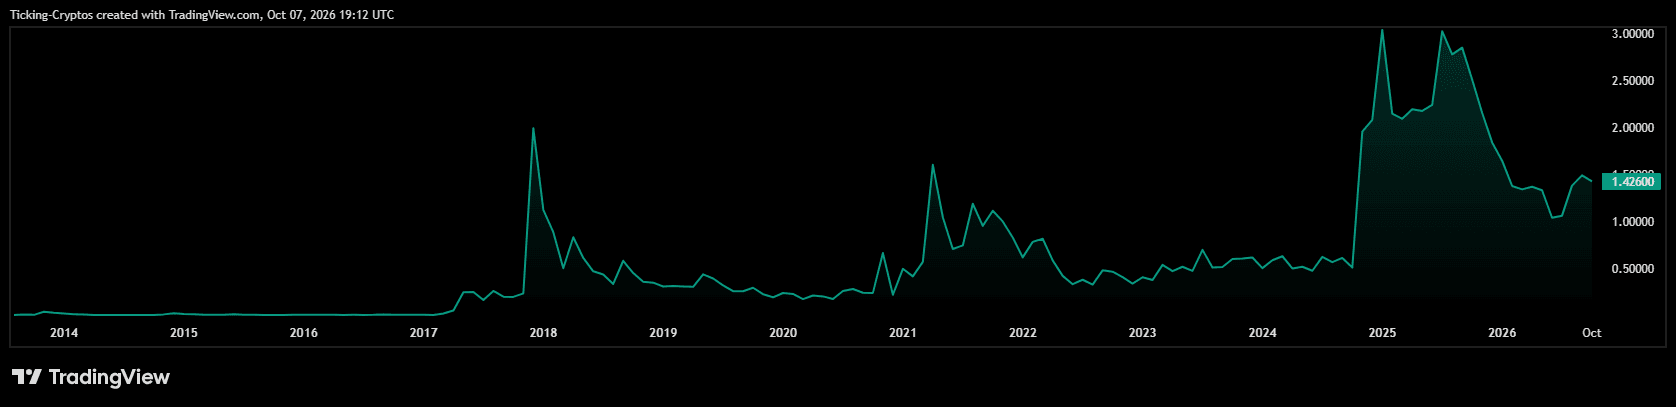
The lesson from history is that XRP moves in explosive, short bursts rather than steady uptrends. Both the 2018 and 2025 peaks were reached in under three months of parabolic movement. The question for $10 is therefore not "can XRP move fast" (it can) but "can it sustain a market cap three times larger than anything it has ever held". That is where the math comes in.
What Would XRP's Market Cap Be at $10?
At $10 per coin, XRP would be worth about $631 billion. The calculation is simple: there are 63.09 billion XRP in circulation today, and 63.09 billion times $10 gives $630.9 billion. Today, at $1.42, the market cap is $89.96 billion, so $10 means growing the market cap seven times over, a gain of 604%.
| XRP price | Implied market cap (63.09B supply) | Where that would rank today |
|---|---|---|
| $1.42 (today) | $90B | #5, behind BNB ($103B) |
| $2.00 | $126B | #4, above BNB |
| $3.84 (all time high) | $242B | #3, below Ethereum ($313B) |
| $5.00 | $316B | #2, roughly level with Ethereum |
| $10.00 | $631B | #2, double Ethereum, 38% of Bitcoin ($1.67T) |
| $28.00 | $1.77T | #1, above Bitcoin today |
A few comparisons put $631 billion into perspective:
- It is more than Ethereum ($313B), Tether ($184B) and BNB ($103B) combined, and roughly a quarter of the entire top-10 crypto market today.
- It is about three times the largest market cap XRP has ever held. At the July 2025 peak of $3.66, with around 58 billion coins circulating, XRP was worth roughly $210 billion.
- Supply keeps growing. Ripple can release up to 1 billion XRP from escrow every month. Even if most goes back into escrow, circulating supply has grown from around 58 billion to 63 billion in a little over a year, which raises the bar for every price target.
- The fully diluted valuation at $10 is about $1 trillion, since total supply is 100 billion XRP. That is where the market would eventually have to settle if escrow is fully released.
For context, Bitcoin needed 16 years, a spot ETF wave and treasury-company buying to reach $1.67 trillion. XRP at $10 would need to get 38% of the way there with a fraction of Bitcoin's ETF holdings. US spot XRP ETFs currently hold around 1.5% to 1.7% of supply versus more than 6% for Bitcoin, according to 247 Wall St.
Can XRP Reach $10? The Bull Case vs the Bear Case
So is a $631 billion XRP possible? Possible, yes. Likely on the timelines most headlines use, no. Here is what each side would have to be right about.
What the bull case needs
- A full crypto bull cycle. XRP has only ever made its big moves when Bitcoin was running. The 2028 halving is the next scheduled catalyst, which is exactly why the credible $10 calls cluster around 2028 to 2030.
- ETF demand to triple or more. ETFs are the one buyer group that kept adding while XRP fell. Getting from 1.7% of supply to 5% or more would absorb a meaningful chunk of escrow releases.
- Real usage on the XRP Ledger. RLUSD, institutional lending (the Clearpool and Cicada proposal), payments and tokenization need to create demand for XRP itself, not just for the stablecoin that runs on top of it. This is the weakest link today.
- A new all time high first. $10 is not on the table until XRP clears $3.84. It has tried once in eight years and failed.
What the bear case points to
- The chart. XRP is down 22.5% in 2026, just lost $1.50, and sits in a range with a 200 EMA that is barely rising. Momentum is pointing down, not up.
- Supply growth. A seven-fold price increase while supply grows means the market cap has to grow by more than seven times. Escrow releases are a permanent headwind that Bitcoin does not have.
- The scale. $631 billion would make XRP double the size of Ethereum, a network with far more applications, fees and developer activity. The market would need a reason to pay that premium.
- Pattern of failed peaks. Both XRP peaks were short parabolic spikes that could not hold. A $10 wick in a frenzy is more plausible than a $10 monthly close.
Our read. A $10 wick during a mania phase around 2028 to 2030 is a tail scenario that cannot be ruled out, because XRP has done 1,000% moves before. A sustained $10, meaning a $631 billion market cap that holds, requires XRP to become the second largest crypto asset by a wide margin with fundamentals to match, and nothing in the current data shows that happening. For 2026, the question is answered by the chart: XRP would need to rise 604% in under three months from a level where it is still losing support.
XRP Price Prediction: Our Verdict on the $10 Target
XRP can reach $10 only in a scenario where the whole crypto market roughly doubles and XRP takes a far bigger share of it than it holds today. That is a 2028 to 2030 story at the earliest, and even then it is a cycle-peak outcome rather than a base case.
- In 2026: no. XRP is at $1.42, below $1.50 and 604% away. Not a single credible source argues for $10 this year; the only one that did was a chatbot that retracted it.
- By 2027 to 2028: unlikely but not impossible. This is Standard Chartered's window and it depends on a full bull market plus ETF inflows that triple. A new all time high above $3.84 would be the first signal that the path is open.
- By 2030: a genuine tail scenario. Bitget and Standard Chartered both land here, and three past drawdowns of 60% were each followed by moves of around 1,000%. A fourth would take XRP from the August low of $1.00 to roughly $10.
What to watch in the meantime is much more mundane: whether the 200-day EMA at $1.38 holds this week, whether XRP can reclaim $1.50 and the $1.65 September high, and whether ETF holdings keep growing while the price does not. Those are the inputs. $10 is the output, and it is a long way off.
0
0

 Manage all your crypto, NFT and DeFi from one place
Securely connect the portfolio you’re using to start.


