
Bitcoin Price Crash Continues: BTC Slips Below $78,000, Here Is the Next Target

0
0

$Bitcoin has lost another battle. After holding above $80,000 for most of the week, BTC broke down hard on October 29 and 30, sliding from around $81,300 to a low near $76,900 in less than 48 hours. At the time of writing, Bitcoin trades at $77,200, roughly 4.5% below where it opened the week and well under the $78,000 zone that bulls had been defending since mid-September.
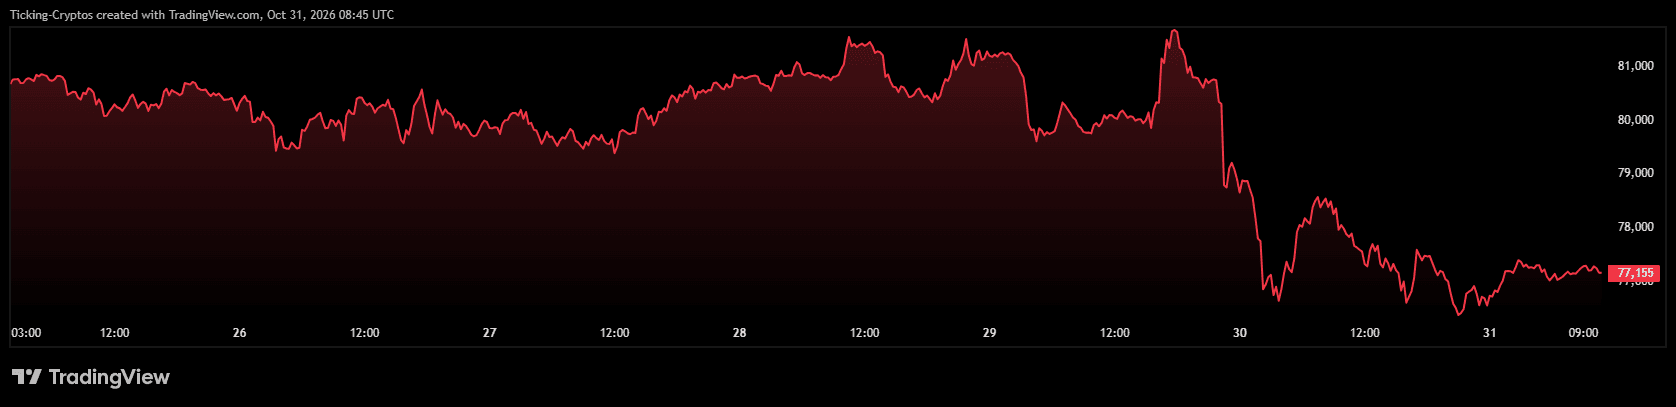
The move was not a slow bleed. The seven-day chart shows a near-vertical drop late on October 29, a brief bounce toward $78,300, and then a second leg lower on October 30 that pushed price into the $76,900s. The bounce since then has been weak, which tells us sellers are still in control.
Why Did Bitcoin Price Crash Below $78,000?
The $78,670 level (orange line on the daily chart) had acted as the floor of Bitcoin’s entire September and October range. Every dip toward it since the August breakout was bought. This week, that changed. Two consecutive red daily candles closed below the line, turning former support into fresh resistance.
Momentum confirms the shift. The daily RSI has dropped to 34, its lowest reading since mid-August, and it is sitting well below its signal line at 44. That is not yet oversold, but it shows the selling has real force behind it rather than being a one-off liquidation wick.
The bigger picture matters too. Bitcoin printed its range high near $87,000 in late September and has been making lower highs ever since: $86,000 in early October, $84,000 in mid-October, and $82,000 just before this week’s breakdown. A series of lower highs followed by a loss of range support is a textbook bearish structure.
Bitcoin Price Analysis: Where Is Support Now?
With $78,670 gone, the chart leaves three clear support zones below current price:
- $76,424: the rising moving average (blue line) that has supported BTC since the August rally began. Price is sitting just above it right now, and Friday’s low at $76,977 tested it without breaking. This is the last line of defense for the bulls.
- $74,450: the next horizontal support, marked by the September 16 swing low area. A daily close below the moving average would most likely open a fast move here.
- $66,803 and $65,000: the pre-breakout range from August. If $74,450 fails, there is very little structure between there and the mid-$60,000s.
On the upside, bulls need to reclaim $78,670 to neutralize the breakdown. Above that, $80,000 is the next psychological level, followed by the $82,000 area where this week’s selloff began.
Bitcoin Price Prediction: Here Is the Next Target for BTC
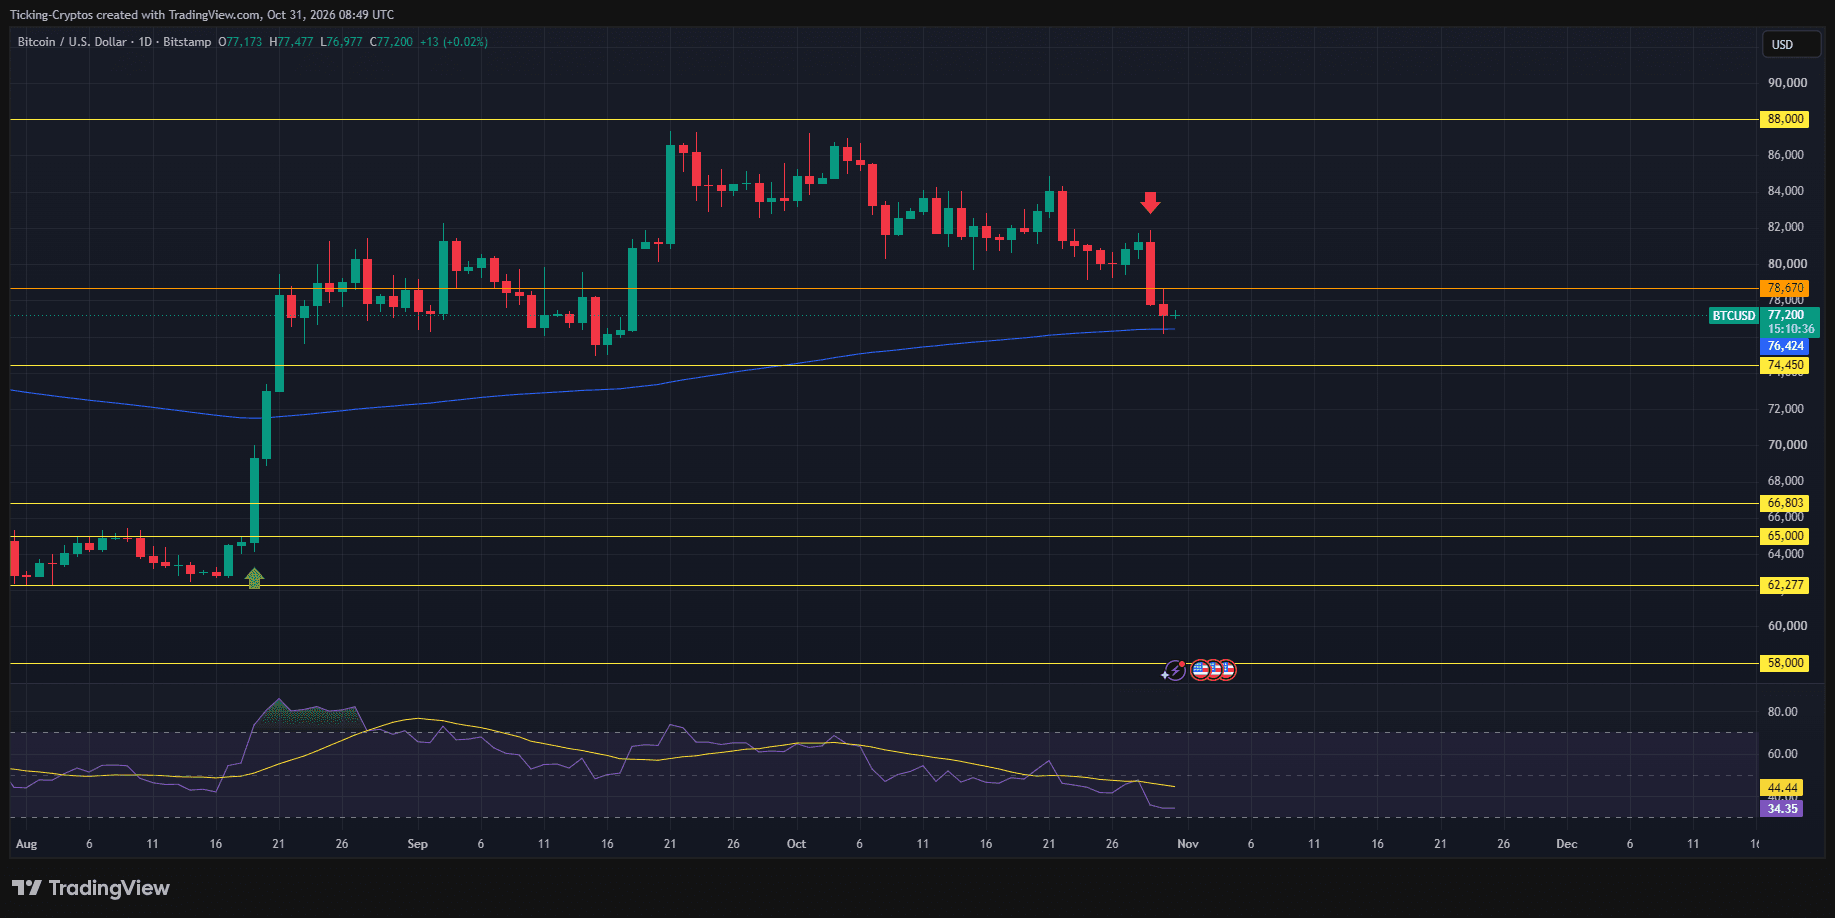
- Bearish scenario (more likely): Bitcoin fails to hold the $76,424 moving average and closes a daily candle below it. The next target is $74,450, which would represent a further 3.5% drop from current levels. If that level breaks on volume, the door opens to $66,800 and $65,000, a roughly 15% decline from today’s price and a full retrace of the August rally.
- Bullish scenario: Buyers step in at the moving average, as they did on Friday, and push price back above $78,670 within the next few sessions. That would flip the breakdown into a failed breakdown, one of the strongest reversal setups in technical analysis, and target a return to $80,000 and then $82,000.
The RSI near 34 means a relief bounce is possible at any time, but bounces in a downtrend tend to fade at the first resistance. Until BTC reclaims $78,670 on a daily close, rallies should be treated with caution.
What Should Traders Watch Next?
Three things decide the next move: the daily close relative to $76,424, whether the RSI dips below 30 (which historically has marked short-term bottoms for BTC), and whether the broader market follows Bitcoin lower. The $74,450 level is the key target if the moving average gives way, and the $78,670 reclaim is the only signal that the correction is over.
Track the live Bitcoin price and other major coins on our crypto prices page.
0
0

 Manage all your crypto, NFT and DeFi from one place
Securely connect the portfolio you’re using to start.
 Where will Bitcoin trade next?
Live Polymarket and Kalshi odds on Bitcoin price targets, compared side by side.
See Bitcoin price odds


