
Bitcoin price breaks below the 200-week line: how low can BTC go?

0
0

Bitcoin broke below its 200-week line on Saturday. The bitcoin price stood at around $65,700 at about 4:50 pm Central European Time, roughly €59,600, after falling as low as $65,020 during the day. That is the lowest intraday low since August 19. The largest cryptocurrency lost a little more than 4 percent in 24 hours and around 13 percent over seven days. Bitcoin had only reached the line at just under $67,800 on Friday evening; the price now sits a good $2,000 below it.
Three numbers define the day: liquidations of more than $1.2 billion in 24 hours, a seventh straight day of outflows from US spot ETFs and a Fear and Greed Index reading of 13, the lowest since early July. None of these figures predicts how far bitcoin can fall. They do show which levels now matter and where the selling pressure is coming from.
Bitcoin price on Saturday evening: $65,700 and an intraday low of $65,020
The slide did not start today. On November 7, bitcoin still closed at $75,747, on November 12 at $71,374 and on November 13 at $68,226. Saturday opened at $68,228, with a high of $68,370. From there the price fell almost without a rebound to $65,020. All figures come from the Bitstamp exchange and are quoted in US dollars.
Bitcoin now trades around 48 percent below its record high of $126,080 set on October 6, 2025. The 200-day line, a moving average of the last 200 daily closes, stands at around $73,000 according to Bitstamp data, the 50-day line at around $80,500. Bitcoin is therefore trading below all three widely watched averages at once. In technical analysis, that is read as a sign of an intact downtrend.
The euro price
For investors in the euro area, the euro price usually matters most. On Bitstamp, one bitcoin cost around €59,600 in the afternoon, with an intraday low of €59,053. Bitcoin has thus also dropped below the €60,000 mark. In the morning, the price was still just under €62,000.
What is the 200-week line, and why do investors watch it?
The 200-week line is the average of the last 200 weekly closes, covering almost four years. It smooths the price over an entire market cycle. In earlier bear markets it often sat close to the lows, which is why many traders regard it as a long-term floor. It is no guarantee: an average describes the past and holds no price in place.
For this article, the newsroom recalculated the line from 200 weekly closes on Bitstamp. It stands at $67,755. Other sources give slightly different values, Altcoin Buzz for example around $67,900, depending on the exchange and the weekly close used. The range therefore runs from about $67,750 to $67,900. cryptoticker.io compiled this analysis itself on November 14, 2026.
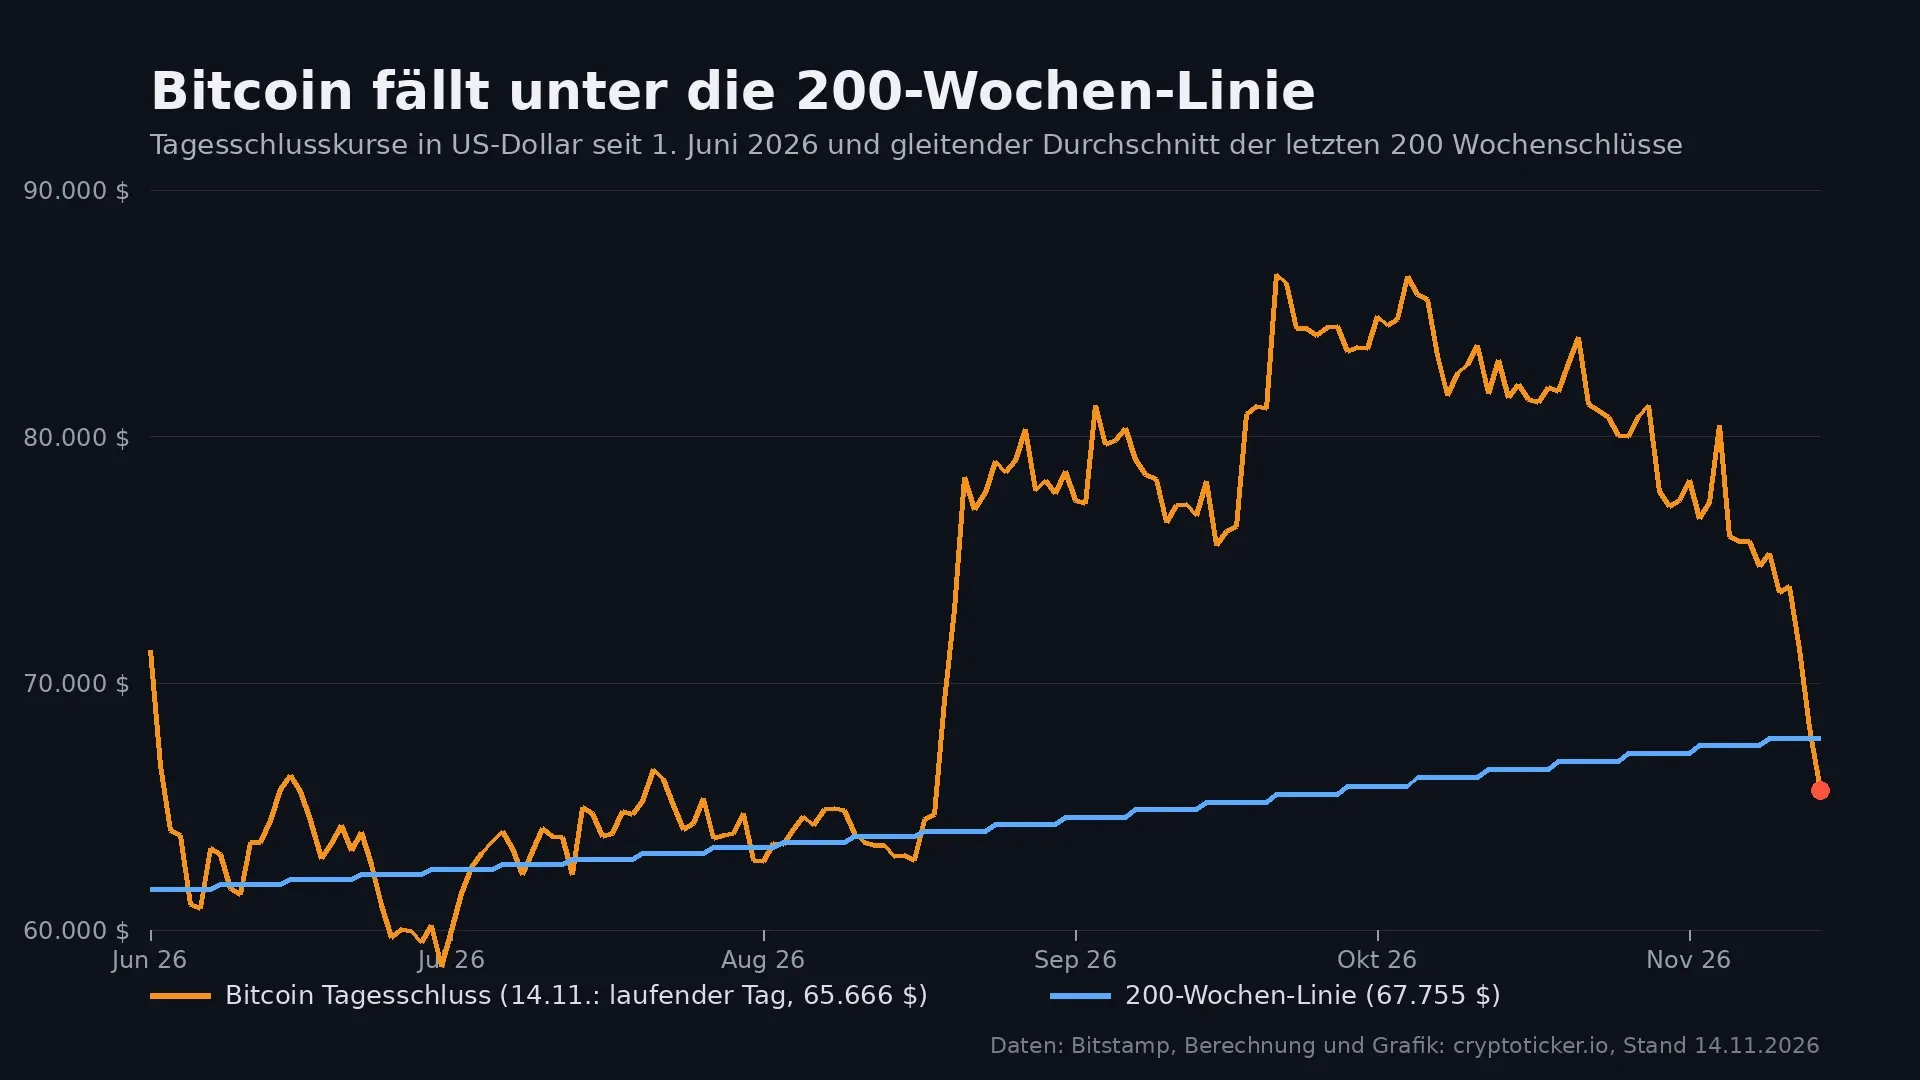
The 200-week line in hindsight: bitcoin was already below it from June to August
The break is not a first. Our own analysis shows that bitcoin repeatedly closed below the line, which was lower at the time, in June, July and until mid-August 2026. The last daily close below it came on August 16. The low of that phase was $57,735 on July 1. From late August, the price then climbed above $78,000 within a few days and closed above $86,000 several times in late September and early October.
The look back shows two things. First, bitcoin can stay below the line for some time; in the summer it was several weeks. Second, that phase was followed by a strong recovery. Whether that repeats cannot be read from the chart. The $57,735 level, however, is the next documented low at which buyers have stepped in before.
Liquidations above $1.2 billion: how long positions accelerated the slide
A liquidation is the forced closure of a leveraged position by the exchange once the posted collateral no longer covers the loss. When the price falls, it is mainly long positions, bets on rising prices, that get closed. The exchange sells automatically, adding further pressure on the price.
According to CoinGlass data analysed by Altcoin Buzz on Saturday, positions worth more than $1.23 billion were forcibly closed within 24 hours. Of these, 82.7 percent were longs. Bitcoin accounted for $637 million, of which 90.8 percent were longs. Depending on when they were measured, other analyses give figures between roughly $700 million and $1.4 billion; the order of magnitude is the same in every case.
If you trade with leverage, you should know the distance between your entry and your liquidation price. At ten times leverage, a price drop of about ten percent is enough to wipe out the collateral, and with fees and funding costs even slightly less. Since November 7, bitcoin has lost around 13 percent. If you use derivatives, our comparison of the best perp DEXs sets out the platforms' margin and liquidation rules side by side.
Bitcoin ETFs: a seventh straight day of outflows at IBIT and FBTC
US exchange-traded funds are not providing any tailwind either. On Friday, November 13, a net $185.4 million flowed out of US spot bitcoin ETFs, according to Farside Investors figures reported by Crypto Briefing. It was the seventh trading day of outflows in a row. BlackRock's iShares Bitcoin Trust (IBIT) lost $143.5 million, the Fidelity Wise Origin Bitcoin Fund (FBTC) $41.9 million. The other funds reported no flows.
Over the seven trading days, outflows add up to around $1.91 billion, according to the same source. For IBIT, Friday was already the eleventh consecutive day of outflows. ETF outflows hit the market directly, because issuers sell bitcoin or buy less for every fund share redeemed. Data for this Saturday will only arrive on Monday, as the funds do not trade at the weekend.
Fear and Greed Index at 13: the lowest reading since early July
The Fear and Greed Index measures sentiment in the crypto market on a scale from 0 to 100. It combines volatility, trading volume and market dominance, among other things, into a single number. Readings below 25 count as extreme fear. According to alternative.me, the index stands at 13 on Saturday, after 20 on Friday and 28 on Thursday.
The index was last this low on July 1, 2026, at 11. That was also the day bitcoin set its summer low of $57,735. It is not a buy signal. Extreme fear can last for days, and in June the index was in single digits several times. The comparison only shows that readings this low last occurred near a turning point.

Ether below $1,850: Ethereum falls harder than bitcoin
The second-largest cryptocurrency is hit harder. Ethereum traded at around $1,840 in the afternoon, about 5 percent below the previous day, with an intraday low of $1,823. Over the week, ether lost a little more than 17 percent, according to CoinGecko. The price is around 63 percent below its record high of $4,946 from August 2025.
The picture is similar for the large altcoins. Solana fell almost 7 percent in 24 hours to around $74, Cardano a little more than 7 percent and Avalanche 8 percent. XRP gave up a little more than 4 percent and, at around $0.98, sits below the one-dollar mark. When bitcoin falls, smaller coins usually lose more, because investors unwind their riskier positions first.
Fed rate decision on December 9: the next macro date for the bitcoin price
Besides fund flows, traders are watching the US central bank. The next meeting of the Federal Open Market Committee takes place on December 8 and 9, according to the Federal Reserve calendar, with the decision due on the second day. In October, the Fed left its key rate in the range of 3.75 to 4.00 percent, as Altcoin Buzz notes. The same source points to higher US producer prices as a burden on rate expectations.
That leaves a good three weeks. Rising rates make safe assets more attractive and tend to pull money out of risky markets such as crypto. A rate decision is therefore often the trigger for big price moves, in both directions.
Bitcoin levels below and above: $64,113, $57,735 and $67,755
To the downside, the next documented level is the intraday low of August 19 at $64,113. Below that comes the zone around $60,000, a round number where many buy and stop orders sit. The summer low of $57,735 on July 1 is the lowest level since June.
To the upside, the 200-week line at around $67,755 is the first hurdle. Above it lies the intraday low of November 12 at $71,040, followed by the 200-day line at around $73,000. Only a weekly close above the 200-week line would undo today's break. The weekly close falls at midnight on Sunday.
Leverage, custody and records: what to sort out now
If you sell at a loss now, you need clean records of your purchases and sales; tax rules differ from country to country. The right programs are listed in our comparison of crypto tax software.
When buying, the provider matters. Since the end of the transition period under the EU's MiCA regulation, crypto service providers in the EU need authorisation. Which platforms hold it and what buying there costs is shown in our comparison of the best crypto exchanges. If you hold bitcoin for the long term, you can move the coins to your own wallet and become independent of the exchange.
Staking plays no role for bitcoin, as the network runs on proof of work. With ether, by contrast, staked holdings can only be sold with a delay in phases like this, because withdrawals from staking pass through a queue.
Bitcoin price: a weekly close above $67,755 would change the picture
The break of the 200-week line, liquidations above $1 billion and ongoing ETF outflows meet a mood as poor as it was in July. Three steps help you put your own position in order:
- Check your leverage: if your liquidation price is above $60,000, a further drop of a little more than eight percent is enough. The platforms' rules are set out in our comparison of the best perp DEXs.
- Document holding periods and losses: record the purchase date and cost basis of every position before you sell. Crypto tax software helps with this.
- Decide how you buy: if you want to add to your position, set the amount and price levels in advance and buy from an authorised provider from our comparison of the best crypto exchanges.
(As of November 14, 2026. This article is not investment advice. Prices and fee structures change; check the terms with the provider before you buy.)
0
0

 Manage all your crypto, NFT and DeFi from one place
Securely connect the portfolio you’re using to start.
 Where will Bitcoin trade next?
Live Polymarket and Kalshi odds on Bitcoin price targets, compared side by side.
See Bitcoin price odds


