
Hyperliquid Price Prediction: Can kHYPE News Lift HYPE to $94?

0
0

Can an exchange tweet change where a token trades next?
That's the question behind this Hyperliquid price prediction, after Kraken gave HYPE a new collateral use within 24 hours of Nov 4, 2026, 10:40 UTC.
Corporate buyers have visited this chart before, with Lion Group's earlier buy the clearest case.
Kraken kHYPE Collateral Update, Explained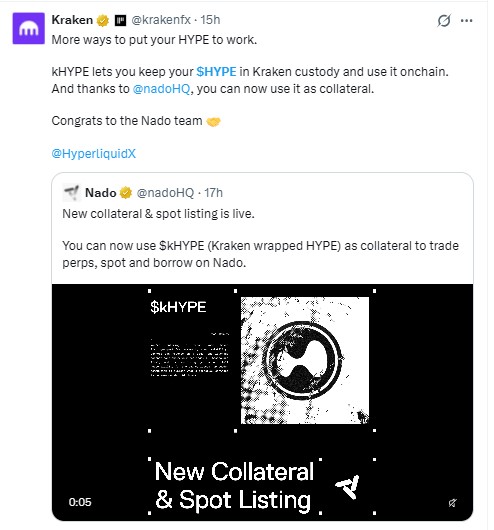
Kraken says kHYPE, its wrapped HYPE held in Kraken custody, now works as collateral on Nado. Kraken's announcement echoes Nado's note that it backs perps and spot trades, plus borrowing.
Collateral is an asset pledged to back a trade or loan, so wider use could keep coins off the sell side.
But no volume figure ties the news to price yet.
HYPE Price Today: Data Snapshot
Metric | Value (Nov 4, 2026, 10:40 UTC) |
Price | $86.65 |
24h change | +3.11% |
7-day change | +6.80% |
24h range | $81.33 to $87.66 |
Market cap | $21.92B |
Fully diluted valuation | $82.33B |
24h volume | $1.35B |
Futures volume | $3.93B |
Open interest | $3.80B |
All-time high | $97.98 |
Volume climbed 19.41%, while price added 3.11%, so HYPE price today has real turnover behind it, per CoinMarketCap data. The price still sits 11.77% under the record.
Open interest counts all open futures contracts, and fully diluted valuation prices every token, circulating or not, at today's rate.
Breaking: Shorts Squeezed After the $81.33 Dip
Sellers lost control fast. Price dipped to $81.33, then ripped back above $86.
Longs paid first, with $7.55M liquidated over 12 hours. Liquidations are forced exits when margin runs dry.
And then the squeeze hit. A short squeeze means sellers must buy back, which lifts the price further. Shorts lost $489.73K in 4 hours against $8.37K for longs, per CoinGlass liquidation data.
Hyperliquid ETF Inflow Returns After an Outflow
The Hyperliquid ETF group posted a $605.08K net inflow as of Nov 3, 2026, 21:00 UTC, all into Grayscale's HYPG. A $2.86M outflow hit the session before.
Net assets sit at $423.04M, up from $412.02M and now 2.06% of market cap, with cumulative inflows at $300.71M, per SoSoValue ETF data.
But $605.08K is small money. So who funds the next leg?
HYPE Technical Analysis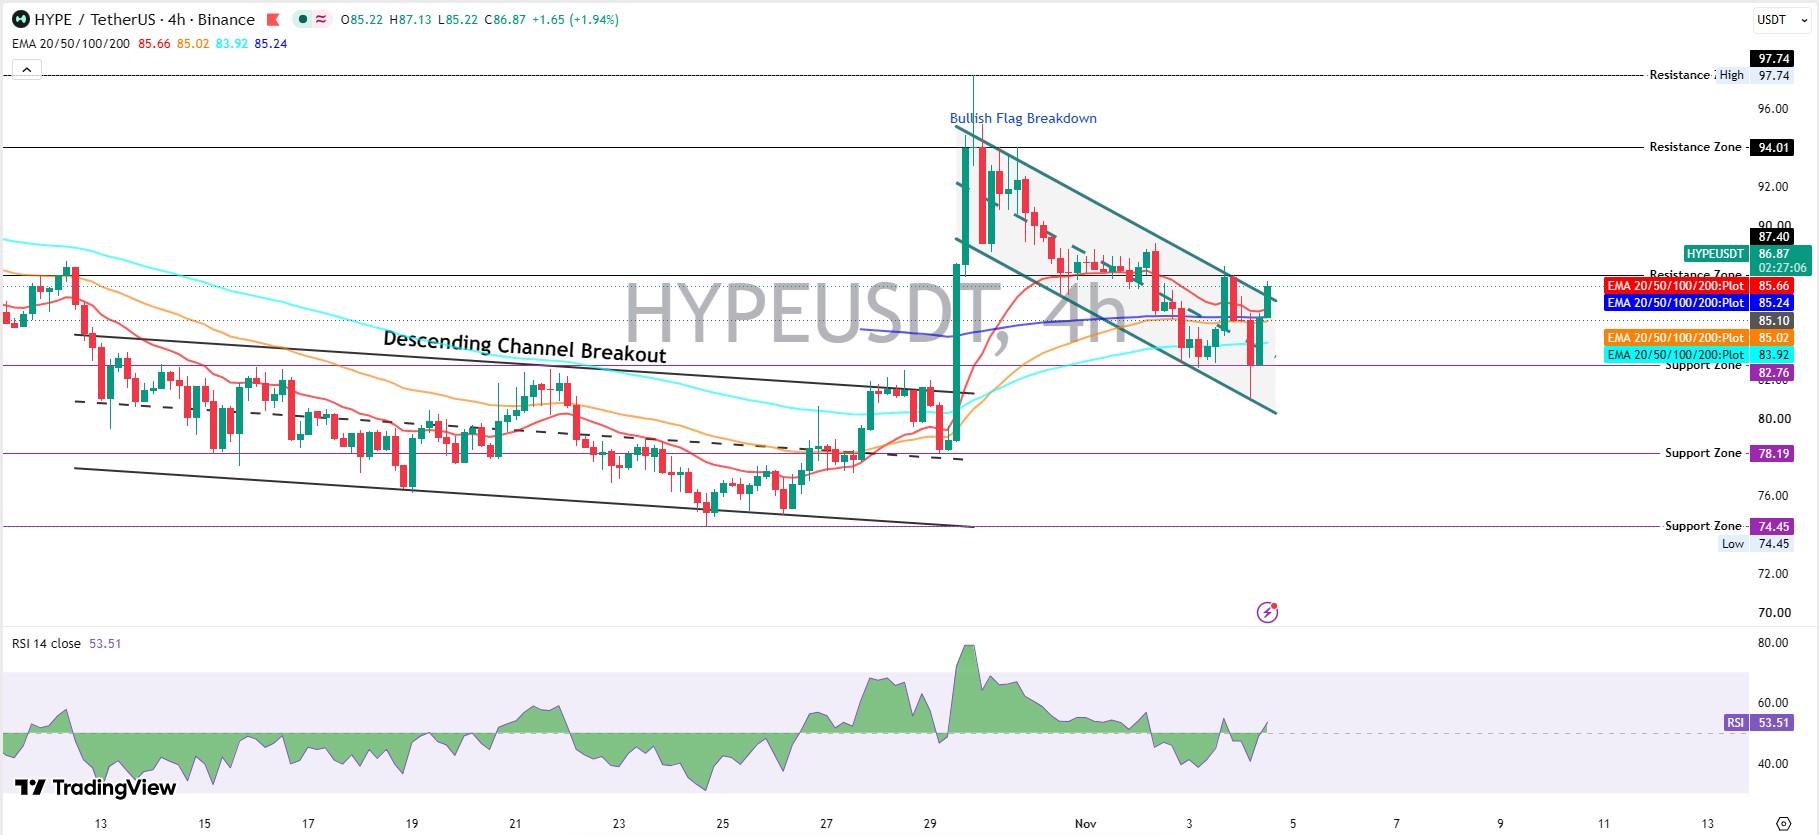
Price spiked to $97.74, then slid inside a falling channel, the same flag zone tracked in the ICE flag setup.
In this HYPE technical analysis, the EMAs work like road markers on that slide. An EMA, or exponential moving average, averages recent prices and gives the latest candles the most weight.
The 20 EMA at $85.66 tracks the last few days and reacts fastest. Next comes the 50 EMA at $85.02, a medium-term read.
Longer term, the 100 EMA sits at $83.92 and the 200 EMA at $85.24, with the 200 EMA above the 100 EMA as a leftover from the falling channel.
Three EMAs sit inside $0.64 of each other, between $85.02 and $85.66. That tight band is the floor buyers must hold.
Then the price dropped to $81.33, a wick under the 100 EMA and the $82.76 support zone. Buyers hauled it back to $86.87 on the latest 4-hour candle.
That reads like a clean breakout. Then again, a single candle proves little.
RSI sits at 53.51, just over the 50 midline. And there's room before the 70 overbought line.
Support and Resistance Levels
Resistance stacks up on the Binance 4-hour chart at $87.40, $94.01, the $97.74 spike high, and the $97.98 record.
Support starts at the $85.66 20 EMA, then $85.02, $83.92, and $82.76, with $78.19 and $74.45 below.
Buyers don't need much. Just a trade above $87.40 that holds.
Hyperliquid Price Prediction Scenarios
Scenario | Trigger | Target | Invalidation | Liquidity Condition |
Bull | Trading above $87.40 and holding | $94.01, then $97.74 | Trading below $85.66 | Volume above $1.35B, ETF inflow continues |
Base | Range between $85.02 and $87.40 | $86.21 midpoint | Break of either edge | Volume near $1.35B, ETF flow near $0 |
Bear | Trading below $85.02 | $83.92, then $82.76 | Reclaim of $85.66 | Long liquidations above $7.78M, ETF outflow returns |
Readers tracking other coins can compare setups in the price prediction hub.
HYPE Price Forecast by Timeframe
Next 24 Hours
Expect a tug-of-war between $85.66 and $87.66, the 20 EMA, and the 24-hour high. The $81.33 dip landed within $0.08 of the $81.251 floor from the earlier bounce or drop levels.
Next 7 Days
Any HYPE price forecast toward $97.74 needs a trade above $94.01 first. That push needs fuel. Volume, mainly, above $1.35B.
But without it, the $86.21 midpoint keeps pulling price back.
Next 30 Days
The earlier November outlook leaned bearish with a $75.354 floor, now $11.30 under price. Higher timeframes lean up, with +52.44% over 90 days against -4.13% over 30 days.
This Hyperliquid price prediction stays bullish above $85.02 and turns bearish below it.
What Could Break the Breakout
Crowding comes first. Top traders on Binance hold 2.06 longs per short by position size, so a trade under $85.02 forces exits fast.
Big wallets add risk too, because buying, like the whale buy news can flip to selling.
And the spot is the weak link. Only $276.44M of it, against $3.93B in futures.
Bottom Line for HYPE Traders
This Hyperliquid price prediction leans bullish while the price trades above the $85.02 to $85.66 EMA band, with $94.01 as the next real test. Below $85.02, sellers get $83.92, then $82.76.
Fresh headlines in the crypto news feed will show whether Kraken's collateral move brings volume.
Disclaimer: This article is for information only and isn't financial advice. Crypto assets are highly volatile, and prices can move sharply in either direction. Do independent research and weigh personal risk tolerance before trading.
0
0

 Manage all your crypto, NFT and DeFi from one place
Securely connect the portfolio you’re using to start.


