
HYPE’s Liquidation Map Reveals a Dangerous Imbalance

0
0

HYPE’s liquidation map reveals a dangerous imbalance, and it tilts to the downside.
The CoinMarketCap liquidation heatmap shows $106.06M of long positions would liquidate below the current price.
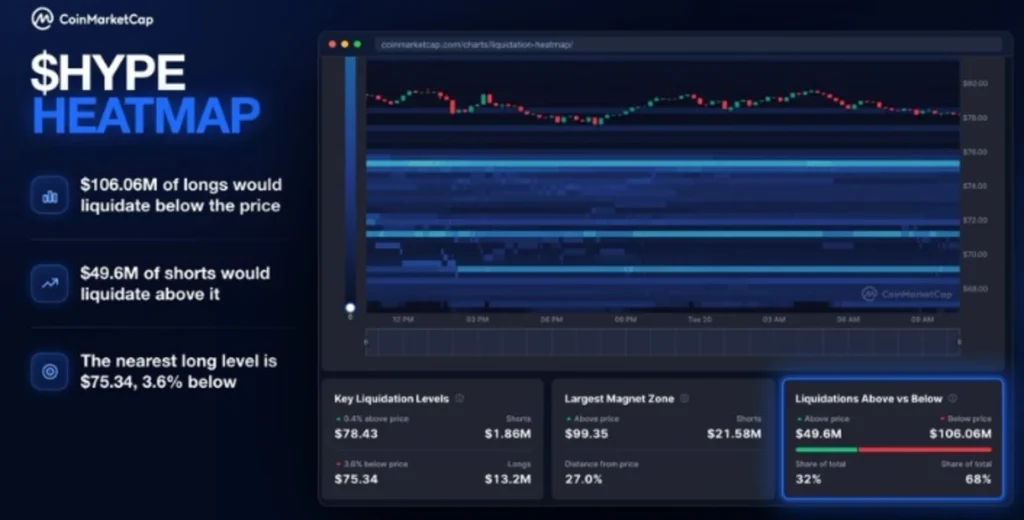
Only $49.6M of shorts would liquidate above it. That means 68% of the exposure sits under price.
What Does the Heatmap Show?
The nearest long cluster sits at $75.34, with $13.2M at stake. It was 3.6% below price when the map was captured. The nearest short cluster sits at $78.43, with $1.86M.
The largest magnet zone is far away at $99.35, with $21.58M of shorts, about 27% above price. Heatmaps differ by provider.
A Coinglass map showed the reverse tilt last week, so liquidation data on Coinglass is worth comparing. Heatmaps are estimates, not guarantees.
Why Does the Imbalance Matter?
Liquidated longs become forced sellers. That can push price lower and trigger more liquidations.
The same logic drives clearing risk in traditional markets, as Europe’s tokenized collateral tests show with their default scenario.
HYPE closed at $94.15 on 5 October and fell to $79.19 on 19 October. Support exists too.
Hyperliquid’s buyback program has burned about 49.69 million HYPE, or 4.97% of the 1 billion maximum supply. Fee strength matters here, as on-chain businesses hit $587M in revenue while DeFi matures.
HYPE Climbs Back Above $80
At about 10:35 UTC on 21 October 2026, HYPE traded at $80.85. That is down 0.7% over seven days. The BTC pair stood at 0.00096984.
The seven-day chart opens near $81.50 on 15 October. Price dipped to about $78.40 that day, then rallied to a peak near $82.30 on 16 October.
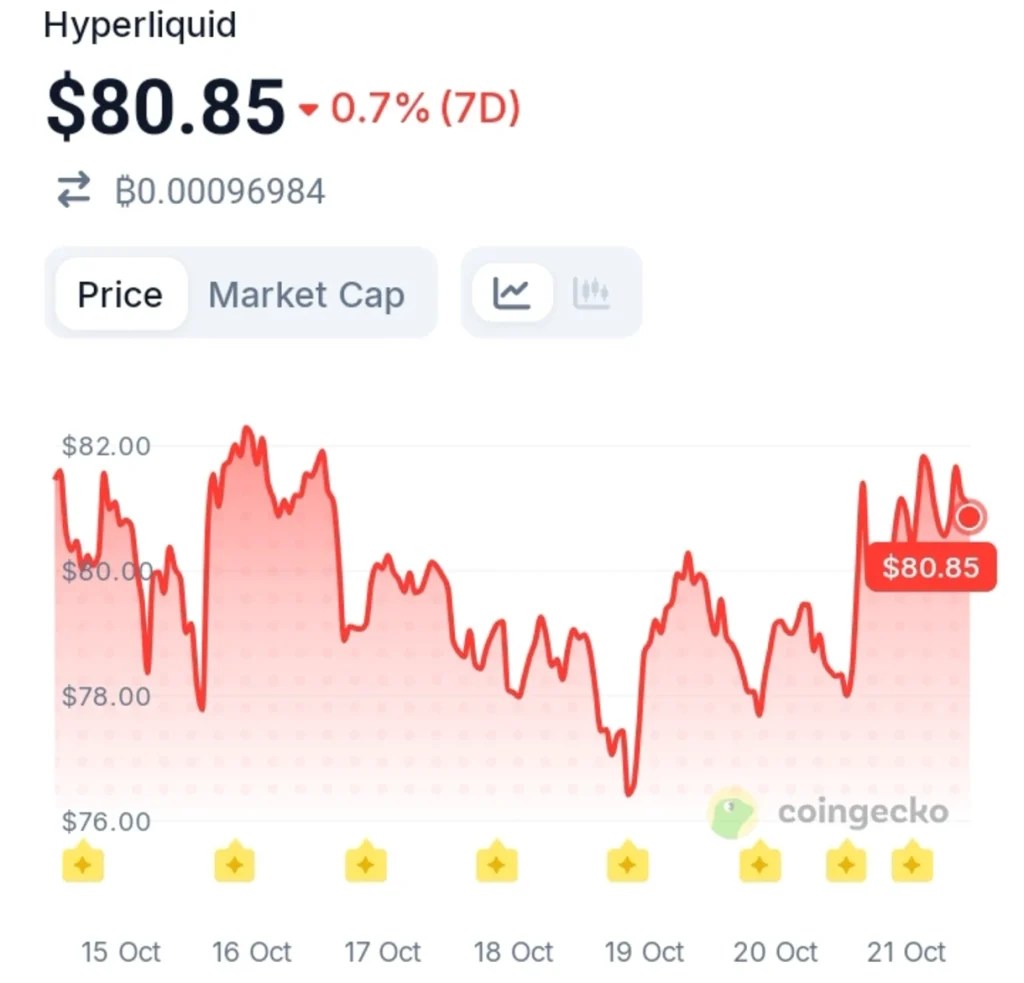
HYPE slid below $79 by 17 October and fell to a low near $76.40 on 19 October. A rebound to $80.30 followed.
Price dropped to about $77.70 on 20 October before jumping to about $81.90 on 21 October. The rally moved price 6.8% above the $75.34 long cluster.
What Could Defuse the Imbalance?
A steady climb would give longs more room. Time also matters, since a stale map loses value as positions change.
Other DeFi corners show strength, such as when Cardano DEX volume jumped 143% in a week. For HYPE, the $75 zone is the line to watch, and traders will know soon if the map was a warning or noise.
Disclaimer:
This article is for informational purposes only and does not constitute financial, investment, or trading advice. The views expressed are based on publicly available data, market observations, and the author’s interpretation at the time of writing. Cryptocurrency markets are highly volatile and unpredictable, and past performance or current technical setups do not guarantee future results. Readers should conduct their own research and consult with a qualified financial advisor before making any investment decisions. TechGaged does not accept liability for any losses incurred based on the information presented.
The post HYPE’s Liquidation Map Reveals a Dangerous Imbalance appeared first on TechGaged.
0
0

 Manage all your crypto, NFT and DeFi from one place
Securely connect the portfolio you’re using to start.


