
Price Predictions 10/28: BTC, ETH, BNB, XRP, SOL, HYPE

0
0

HYPE is struggling to break above its 14-day high. Wednesday’s candle suggests modest buying pressure, but not enough to push prices higher.
Looking back, the asset is edging closer to recording its third consecutive day of gains. Cumulatively, it is up more than 7% over the last 72 hours.
Interestingly, the global crypto market cap is also experiencing increased volatility on Wednesday and is trading in the green. It remains to be seen whether the uptrend will last for the remainder of the week. However, the candle representing the current price action has a long upper wick, raising concerns about a possible correction in the coming days.
Away from the charts, a previous outlook identified the FOMC meeting as one of the biggest events to watch this week. The meeting has now taken place, with policymakers voting to keep interest rates unchanged. The announcement triggered slight upticks across the market, but the gains are fading at the time of writing.
With the interest rate decision out of the way, the PCE report and weekly jobless claims are next on the list. Prices may react adversely if the figures come in as expected, with an even stronger reaction possible if they exceed forecasts.
With these fundamental events in focus, let’s examine what the charts suggest about the next price direction.
BTC/USD
Bitcoin saw a slight uptick hours before the rate announcement but began shedding gains as the event approached. Although it remains in the green on the 1-day chart, it is printing a doji. A closer look shows the middle Bollinger Band acting as resistance this time, potentially signalling further weakness.
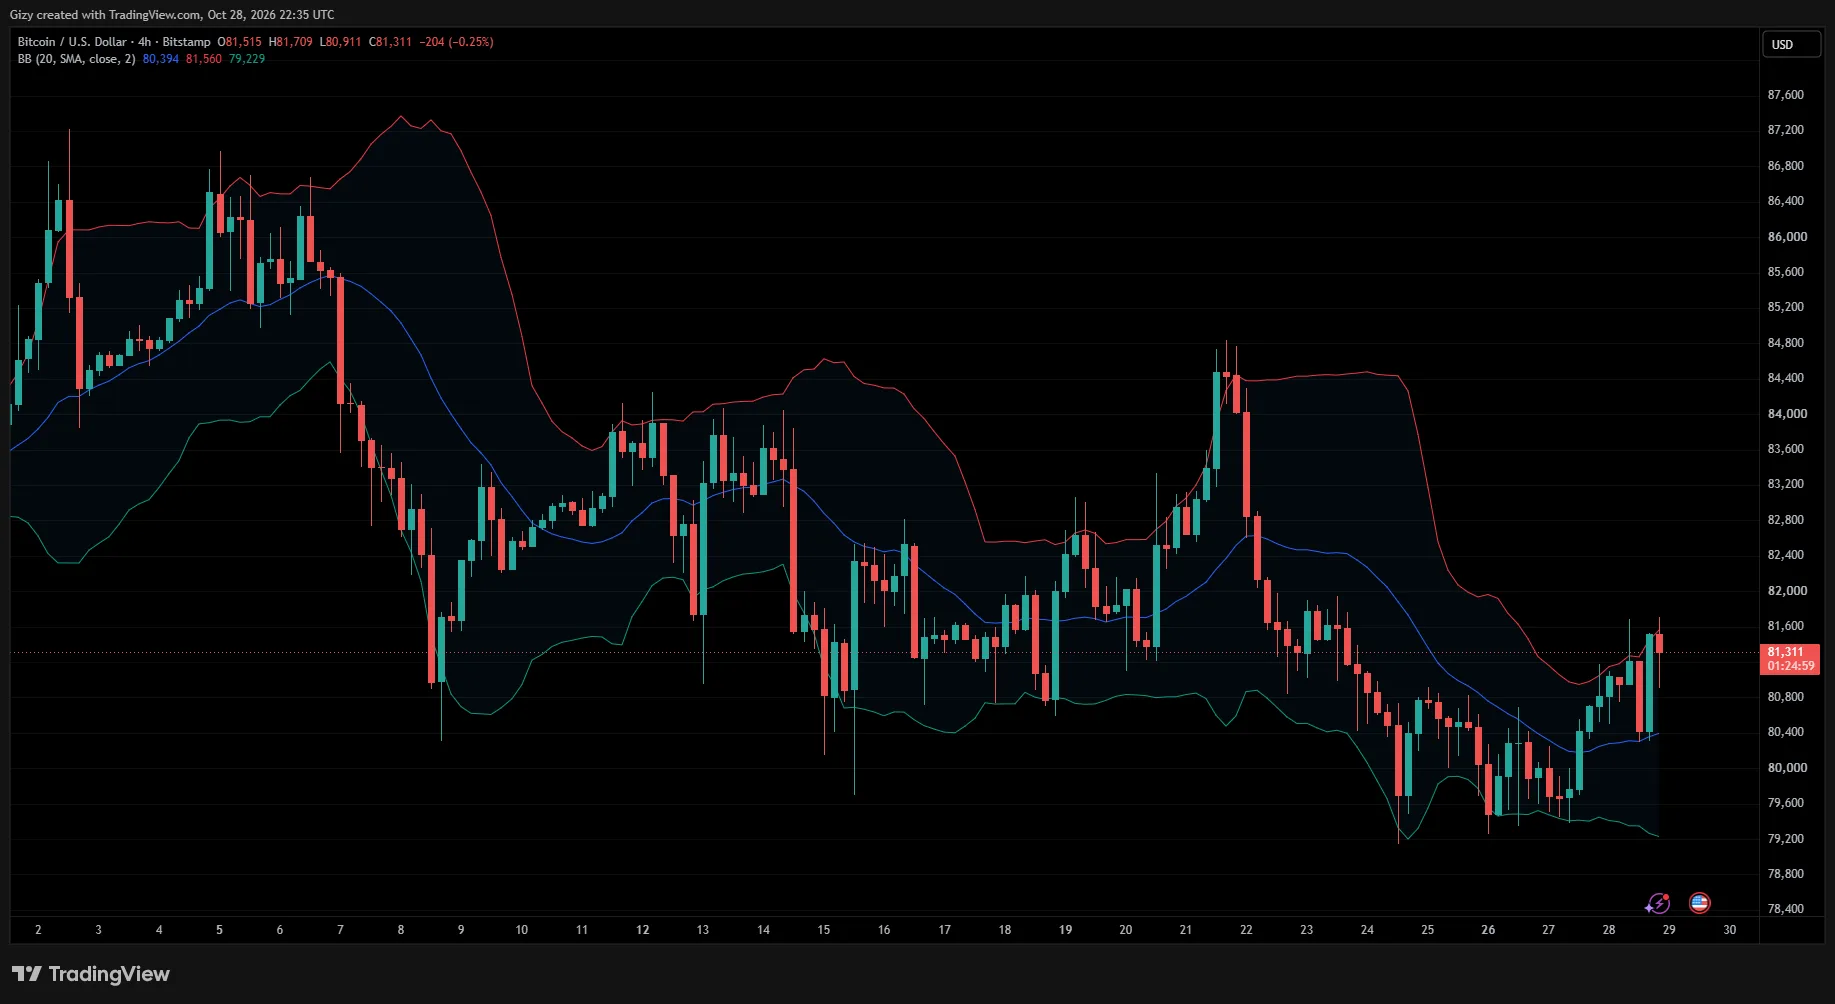
On the 4-hour timeframe, the Bollinger Bands also played a significant role. This time, the upper band acted as resistance. It also coincides with $81,800, a level the apex coin has failed to break above since Friday.
Bitcoin is currently printing a red candle and may be heading lower following its rejection at resistance. The last time it failed to break above this level, it retraced to $79,500. Based on this previous failed attempt, a drop below $81K remains likely.
ETH/USD
Like HYPE, ETH recorded notable gains during the previous intraday session but is currently struggling to extend its rally. It is also printing a doji on the 1-day chart as upward momentum wanes.
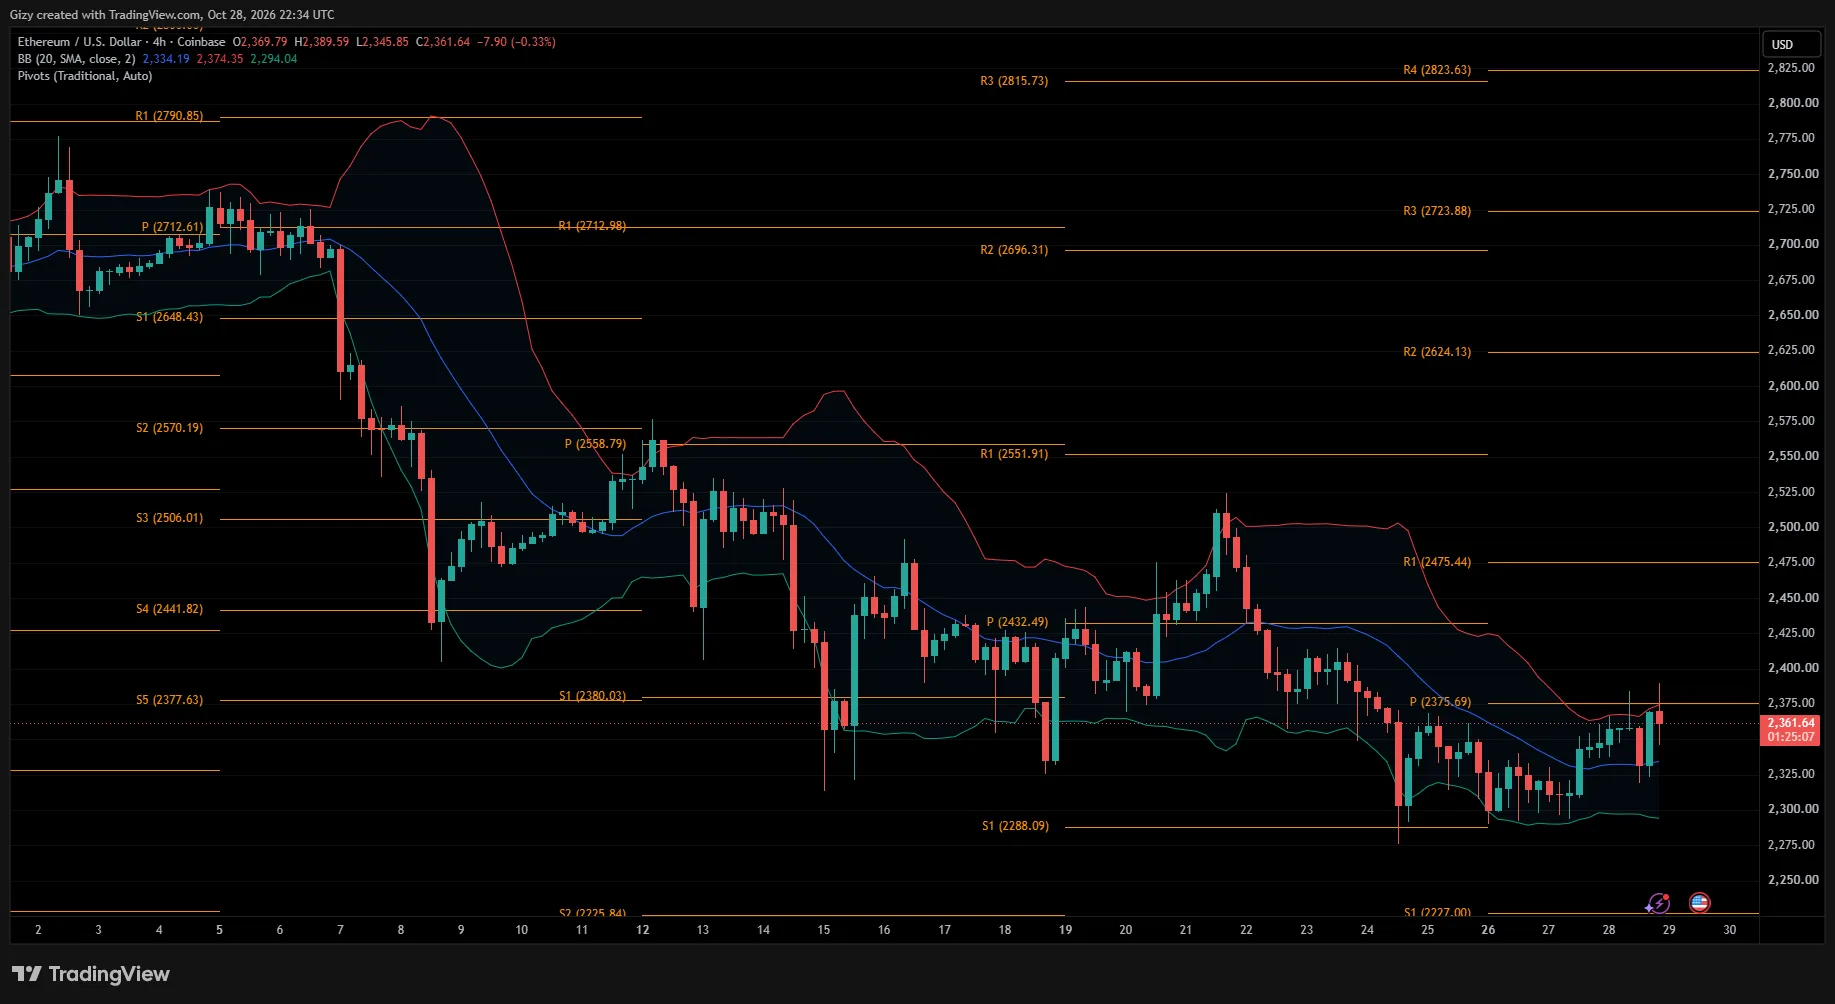
However, the 4-hour chart suggests that there may be more to the doji. ETH’s recent uptick stalled after it broke above $2,370. Interestingly, this level is also the pivot point. According to the PPS, a decisive move above it could see ETH retest R1 at $2,475.
However, ETH’s inability to sustain its advance above this level presents a grimmer outlook. The next key level lies at $2,225 (S1), and the asset may retrace to this level before the week ends.
The Bollinger Bands, however, suggest that the altcoin may not fall that low. It is worth noting that ETH stalled shortly after breaking outside the bands. If prices decline, the lower band may serve as support, potentially bringing ETH back to its previous low of $2,290.
BNB/USD
BNB is up almost 2% on the 1-day timeframe, marking its largest gain this week. It has maintained its uptrend for almost three consecutive days and has also broken above the previous week’s high.
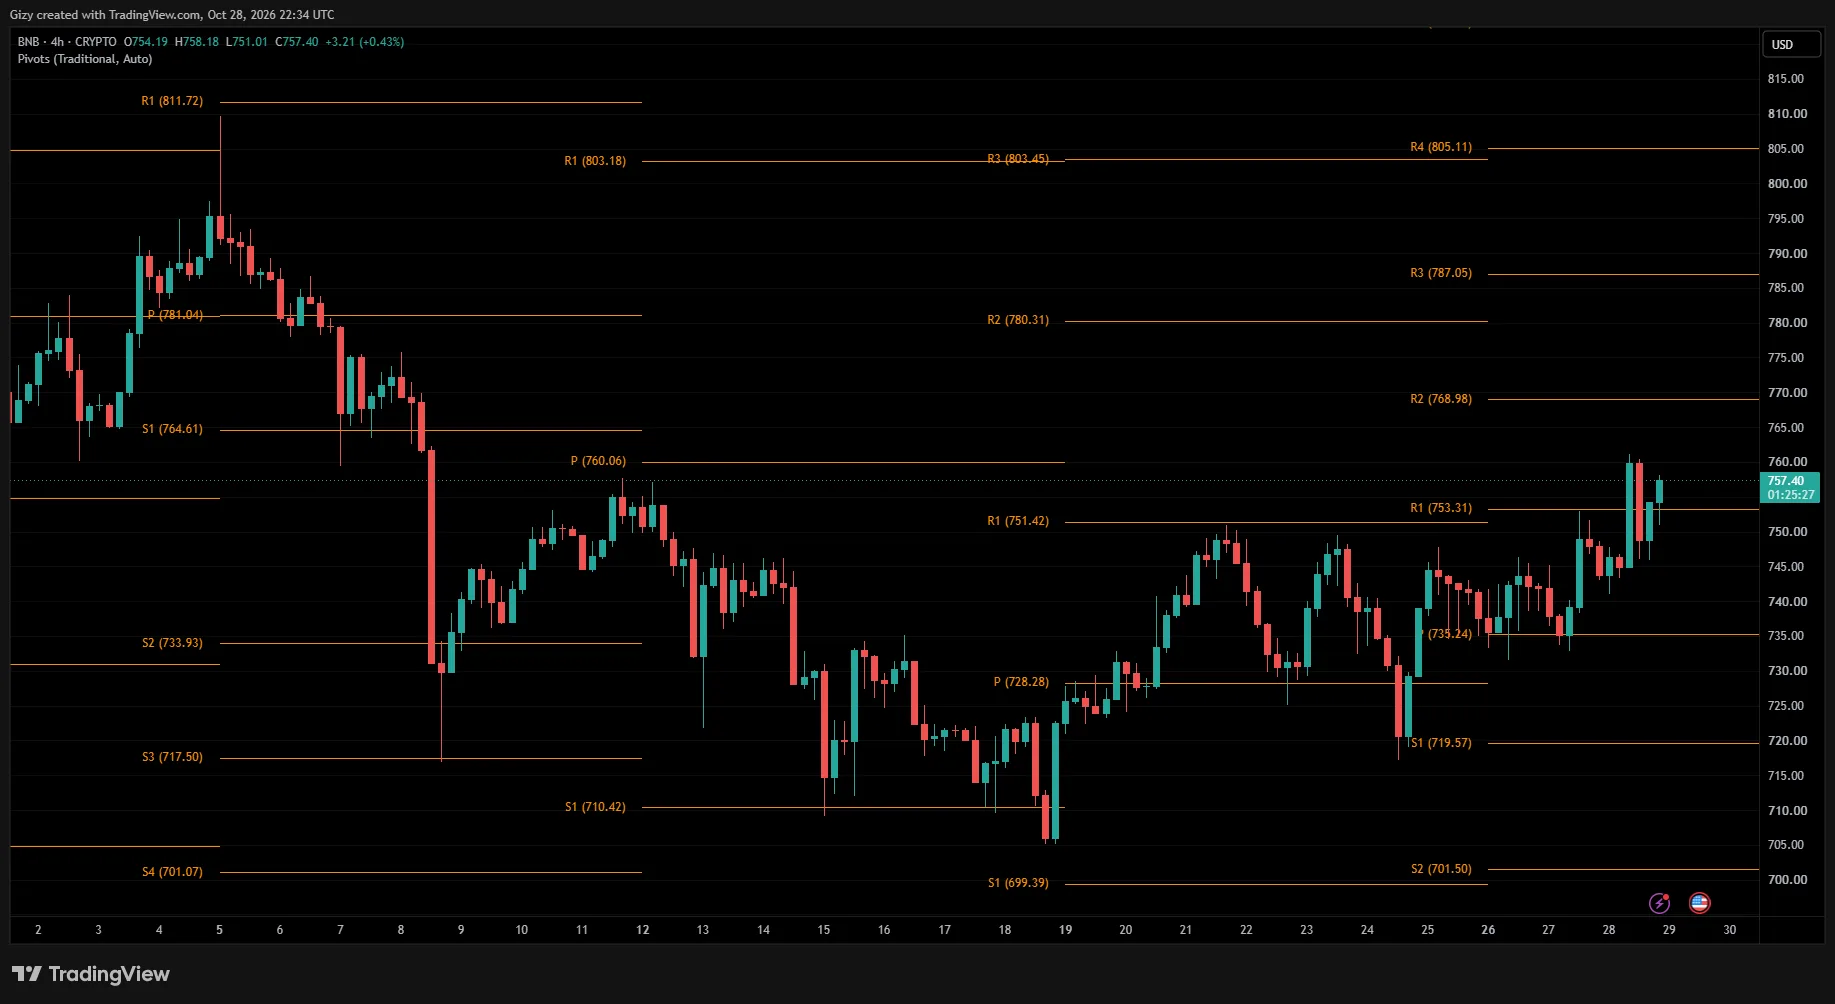
On the 4-hour chart, BNB has been trading in an upward pattern since Tuesday. The broader move began on Saturday, but upward momentum is now waning. The latest candle shows muted price action, suggesting that the rally may be losing steam.
Nevertheless, the asset recently broke above its pivot point, and the latest candle opened above the level and may close there as well. If the bulls sustain the upward momentum, a surge toward R1 at $770 may follow.
XRP/USD
On the 1-day timeframe, XRP may end the day with little change, much like HYPE. However, it remains in the green and has maintained an uptrend over the last two days.
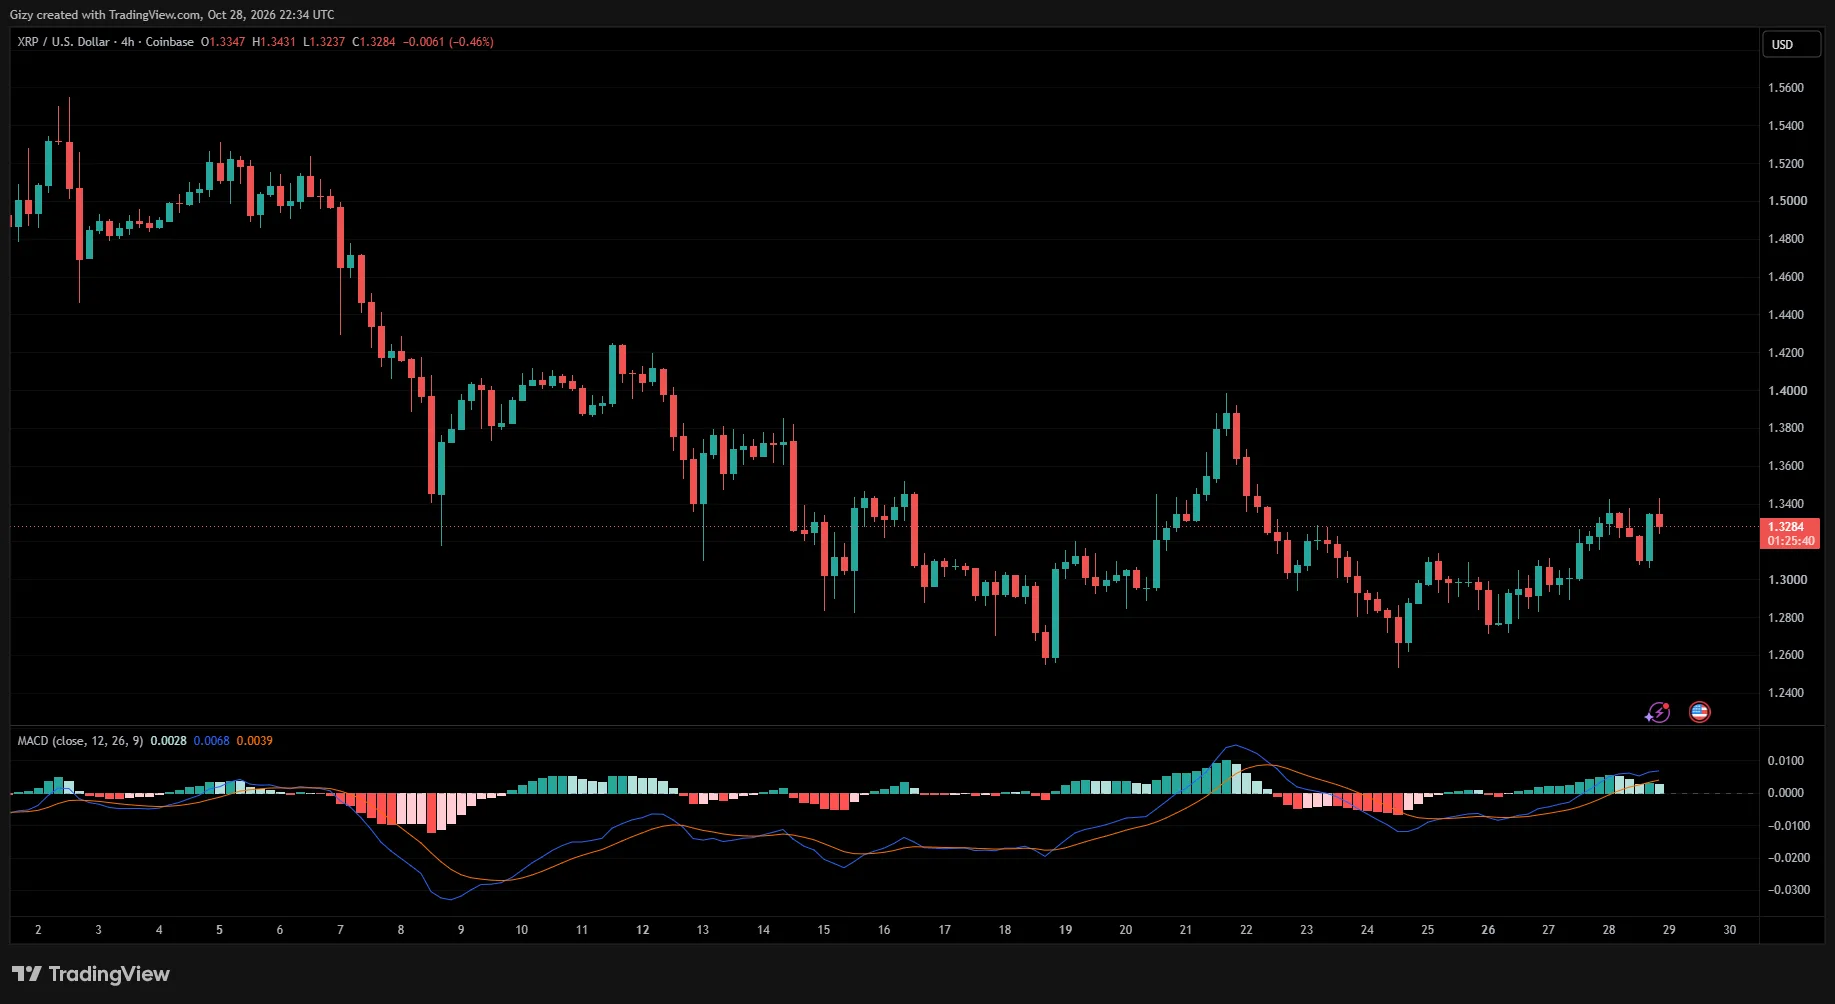
One indication of this upward momentum was the Moving Average Convergence Divergence (MACD), which recorded a crossover on Monday on the 4-hour chart. However, the first signs of a potential downturn are now emerging, as the indicator’s histogram bars are getting smaller.
As bullish sentiment gradually wanes, XRP may be gearing up for another leg down. Following its failure to break above $1.34, a drop below $1.30 remains possible, with previous price movements identifying $1.27 as the next level to watch.
SOL/USD
Solana retested its four-day high a few hours ago but faced rejection at a key level. The 4-hour chart offers a clearer picture of what happened and how it may affect future price action.
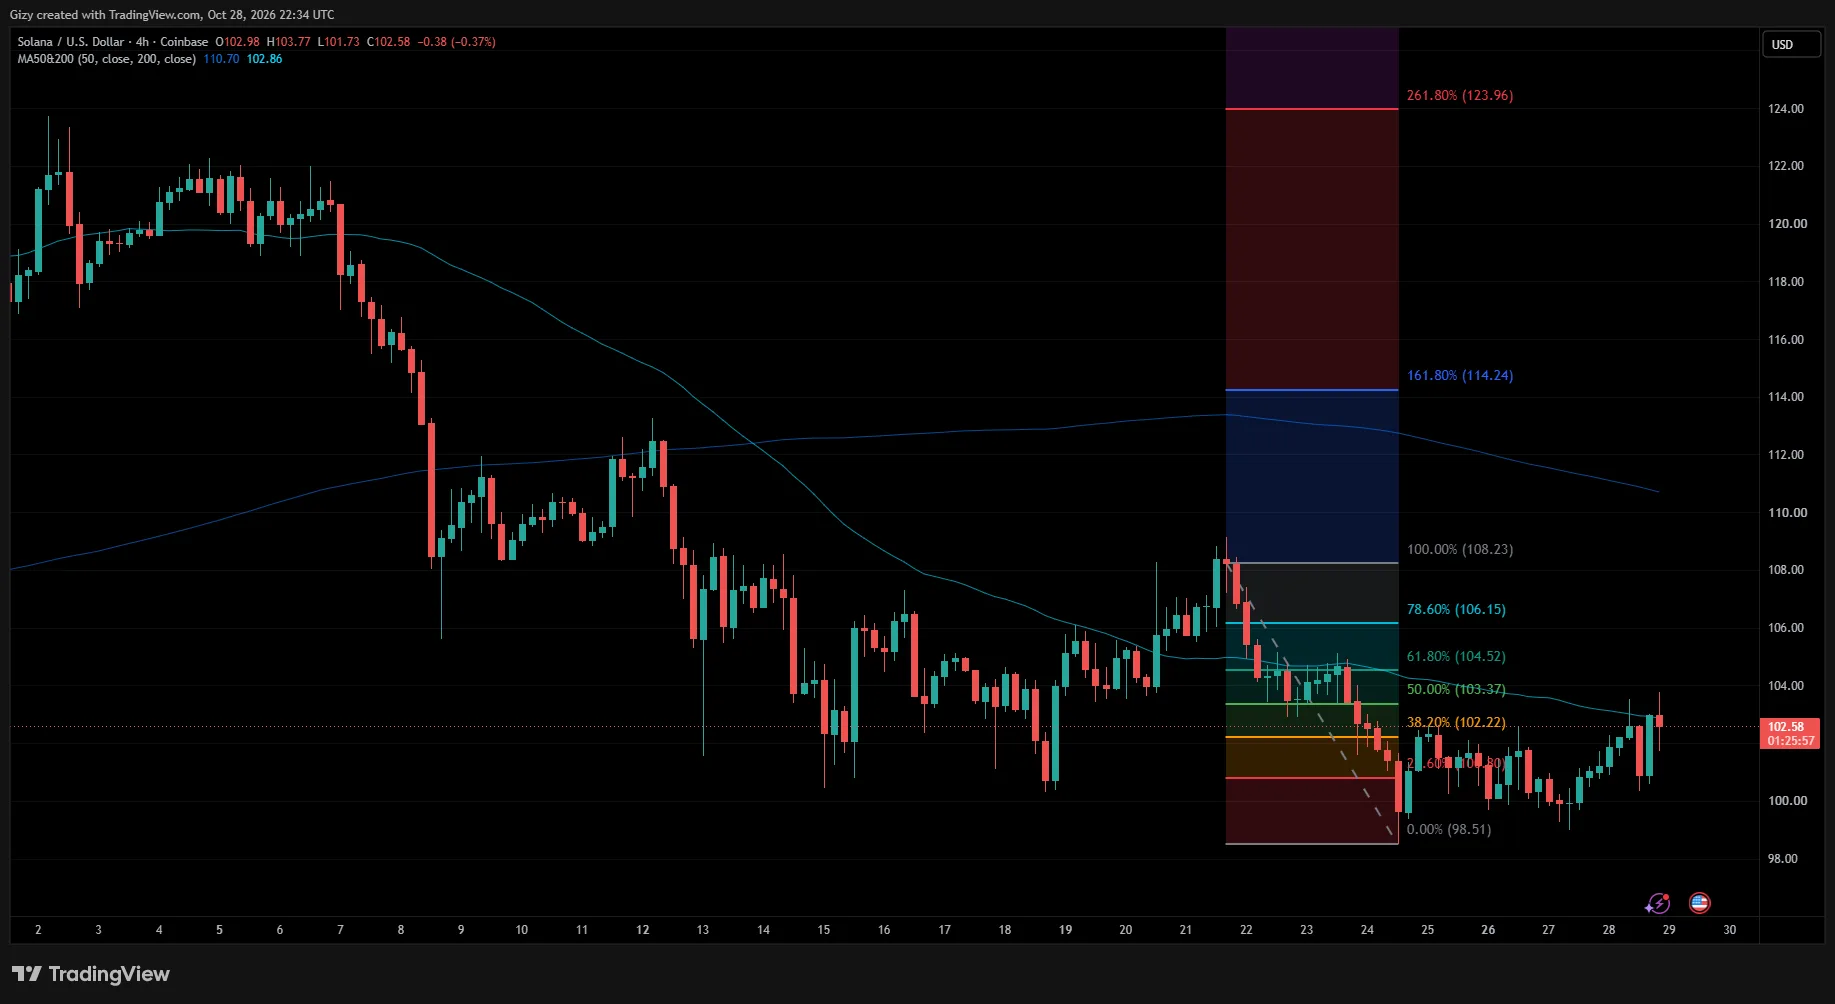
The asset was unable to break decisively above the 50% Fibonacci retracement level. Looking back, this level has served as critical support several times over the last 30 days. Now that it has become resistance, the same barrier appears to be limiting further gains. Coincidentally, the 50-period moving average is also acting as resistance.
The last time SOL failed to break above this level, it dropped 5%. Based on this previous price action, the likelihood of further declines appears significant.
The Fibonacci retracement levels suggest that a move toward $98 could occur in the coming days.
HYPE/USD
On the 4-hour chart, HYPE hit a wall at $82. Interestingly, this is not the first time an uptrend has stalled at this level. Since dropping below it on October 15, the asset has struggled to break back above it, with each failed attempt followed by further declines.
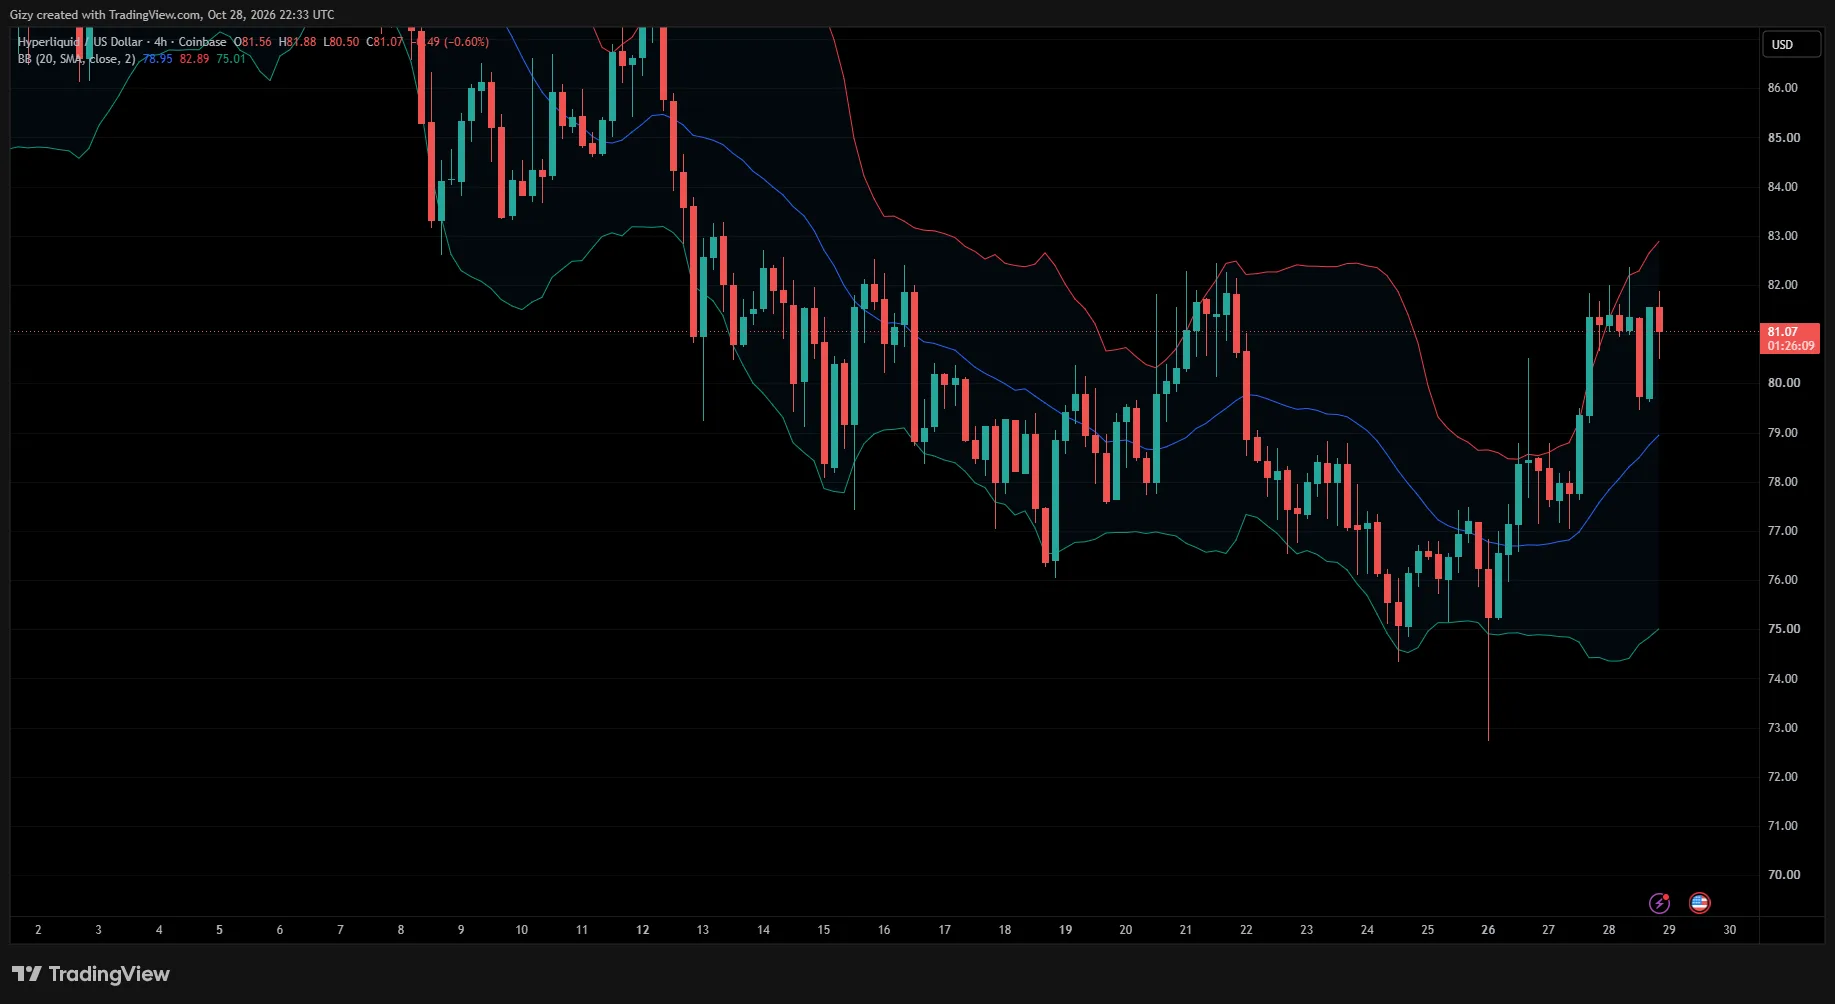
This time, the barrier coincides with the upper Bollinger Band. Given the rejection at this level, a reversal may be developing, and the latest candle has turned red.
If selling pressure persists, HYPE may drop toward the middle Bollinger Band at $79. However, if the bulls fail to defend this level, a further decline toward $75 is possible.
The post Price Predictions 10/28: BTC, ETH, BNB, XRP, SOL, HYPE appeared first on CoinTab News.
0
0


 Manage all your crypto, NFT and DeFi from one place
Securely connect the portfolio you’re using to start.
 Where will Bitcoin trade next?
Live Polymarket and Kalshi odds on Bitcoin price targets, compared side by side.
See Bitcoin price odds


