
How to read a candlestick chart: what 999 daily bitcoin candles reveal about the hammer and the doji

0
0

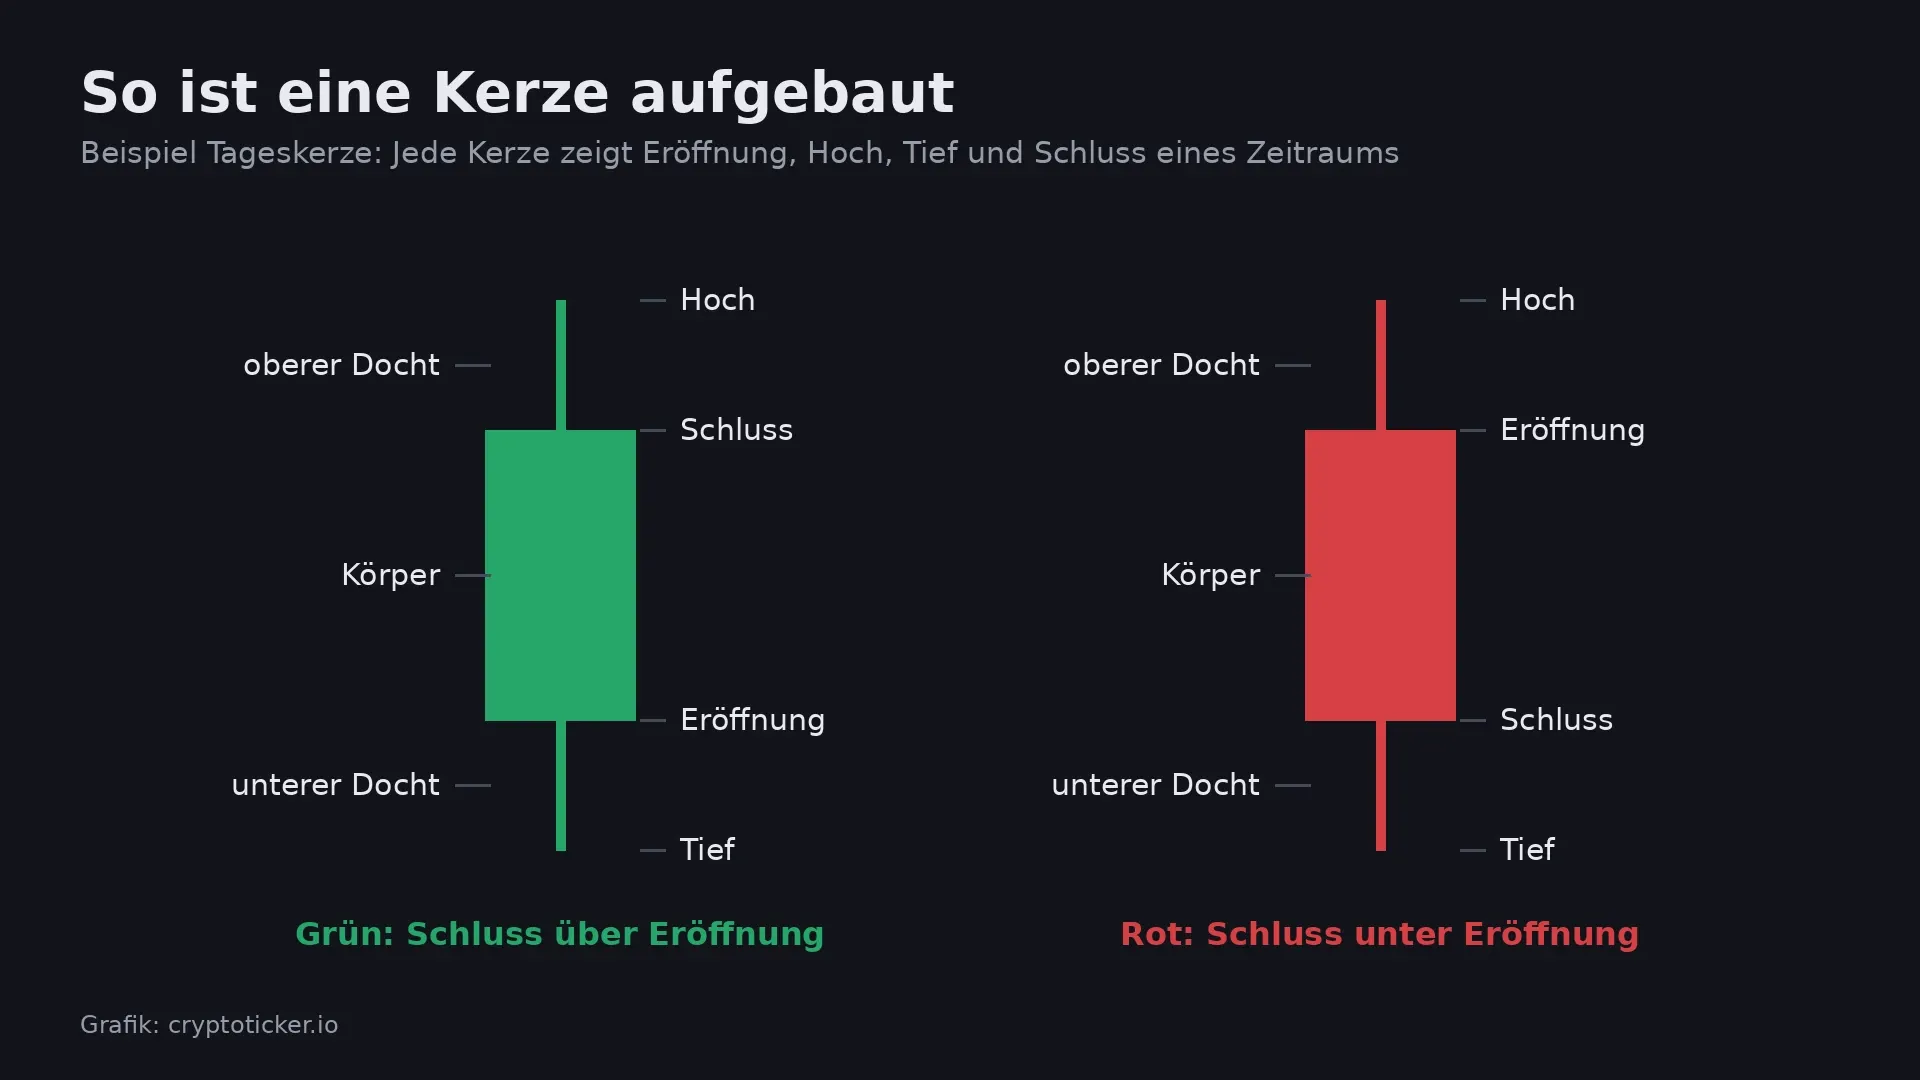
You read a candlestick chart by treating each candle as a summary of one period: the thick body shows where the price opened and closed, and the thin wicks show the high and the low in between. If the candle is green, the closing price was above the opening price; if it is red, below. With these four values, open, high, low and close, you can see at a glance how sharply a market swung and which side came out ahead at the end.
In crypto, the candlestick chart is the default view: almost every exchange and every charting tool first opens the price of Bitcoin and other coins as a candlestick chart. Anyone buying or selling there sees candles all the time, whether they want to or not. This guide explains how candles are built, the best-known candlestick patterns and their limits. On top of that comes our own analysis: we checked 999 daily bitcoin candles to see what actually happened to the price after a hammer, a doji or an engulfing pattern.
What a candlestick chart shows: open, high, low and close
A candlestick chart is a way of displaying price data in which each period appears as its own candle. Analysts speak of OHLC data, after open, high, low and close. A simple line chart only connects the closing prices and so hides what happened between two closes. The candle, by contrast, also shows the swings up and down.
An example makes this concrete: if bitcoin opens a day at $74,000, climbs to $76,000 along the way, drops to $72,500 and closes at $73,500, the result is a red candle. Its body runs from $74,000 down to $73,500, the upper wick reaches $76,000 and the lower wick $72,500. A line chart would have kept only the point at $73,500 from that day.
A bar chart, also called an OHLC chart, contains the same four values but draws them as a vertical line with two small horizontal ticks. The information is identical. The candlestick chart won out because the filled bodies and the colours are quicker to take in, especially when a hundred or more candles sit side by side.
Candle body and wick: which side had the upper hand at the end
The body of a candle is the distance between the opening and the closing price. A long green body means buyers carried the price higher throughout the period. A long red body shows the opposite: selling pressure lasted until the close. A very short body means that open and close barely differ and neither side won the period.
The wicks, also called shadows, mark the extremes. A long upper wick shows that the price was clearly higher at some point, but sellers pushed it back down. A long lower wick shows that the price slumped and buyers brought it back up. A candle with no wick at all forms when the price never moved beyond the close or below the open during the entire period.
The colour is a convention, not a law of nature. Most crypto exchanges draw rising candles green and falling ones red. In older books and some programs, rising candles are hollow or white and falling ones filled or black. Many trading apps let you swap the colours, and in parts of Asia red traditionally signals rising prices. So when you read an unfamiliar chart, check the legend first.
Timeframes in a candlestick chart: why the daily crypto candle closes at night
Each candle stands for a period you can choose freely, known as the timeframe. Common settings are one minute, five minutes, one hour, four hours, one day and one week. The same market can look completely different depending on the timeframe: a thick red daily candle may, on the hourly chart, consist of a brief slump in the morning and a slow recovery in the afternoon.
For stocks, the daily candle starts and ends with the exchange's trading hours. Cryptocurrencies, by contrast, trade around the clock, weekends included. The daily candle therefore needs a fixed time. On Bitstamp, whose data our analysis below uses, it starts at midnight Coordinated Universal Time (UTC), which is 1 a.m. German time in winter and 2 a.m. in summer. Other platforms may use different times, and then the same daily candle looks different on two charts.
A second peculiarity concerns price gaps. With stocks, the price often opens well above or below the previous day's close in the morning because news came in overnight. With bitcoin, the opening price almost always matches the previous close: in our 999 daily candles, the open was less than 0.1 percent away from the prior close 995 times. Patterns that textbooks describe as requiring such a gap therefore rarely appear in pure form in crypto trading.
Doji, hammer and shooting star: the key single-candle patterns
A candlestick pattern is a shape made of one or more candles to which chart analysts attribute a message about the price's next move. You should be able to recognise the three best-known single candles, because they show up in almost every chart analysis.
Doji: open and close almost identical
In a doji, the opening and closing prices are so close together that barely any body is visible. The candle looks like a cross or a plus sign. The doji is seen as a sign of indecision: buyers and sellers pushed the price back and forth, and in the end it stood where it had started. Textbooks distinguish subtypes such as the dragonfly doji with a long lower wick and the gravestone doji with a long upper wick. Our older article on candlestick patterns illustrated with the Ethereum price shows an example.
Hammer: long lower wick after a decline
The hammer has a small body at the top and a lower wick at least twice as long as the body. It only counts as a hammer when it appears after a move lower. The reading: sellers pushed the price down hard, and buyers won it back almost entirely by the close. If the same shape appears after a rise, it is called a hanging man and is read as a warning sign.
Shooting star: long upper wick after a rise
The shooting star is the mirror image of the hammer. The small body sits at the bottom with a long wick above it. After a rise, it shows that buyers drove the price far higher, but sellers caught it again by the close. The same shape after a decline is called an inverted hammer.
Engulfing, morning star and harami: patterns made of two and three candles
Patterns made of several candles describe a shift in sentiment over several periods. In a bullish engulfing pattern, a red candle is followed by a green one whose body completely covers the red body. After a decline, this is taken as a sign that buyers have taken control. The bearish engulfing pattern is its counterpart after a rise: a large red candle swallows the green one before it.
The harami is in a sense the reverse of the engulfing pattern. Here, a small candle sits entirely within the body of the large candle before it. The pattern is read as a sign that the previous move is losing strength. The morning star consists of three candles: a long red one, a small candle with barely any body and a long green one that reaches deep into the body of the first. Its counterpart at the end of a rise is the evening star.
What all patterns have in common is that they need context. A hammer in the middle of a sideways phase says little. Analysts therefore also look at the prior trend, at the candle's trading volume and at whether the pattern forms at a level where the price has turned before. Many also combine candles with indicators such as the Relative Strength Index, which our article on bitcoin's RSI explains.
Candlestick patterns put to a bitcoin test: 999 daily candles analysed
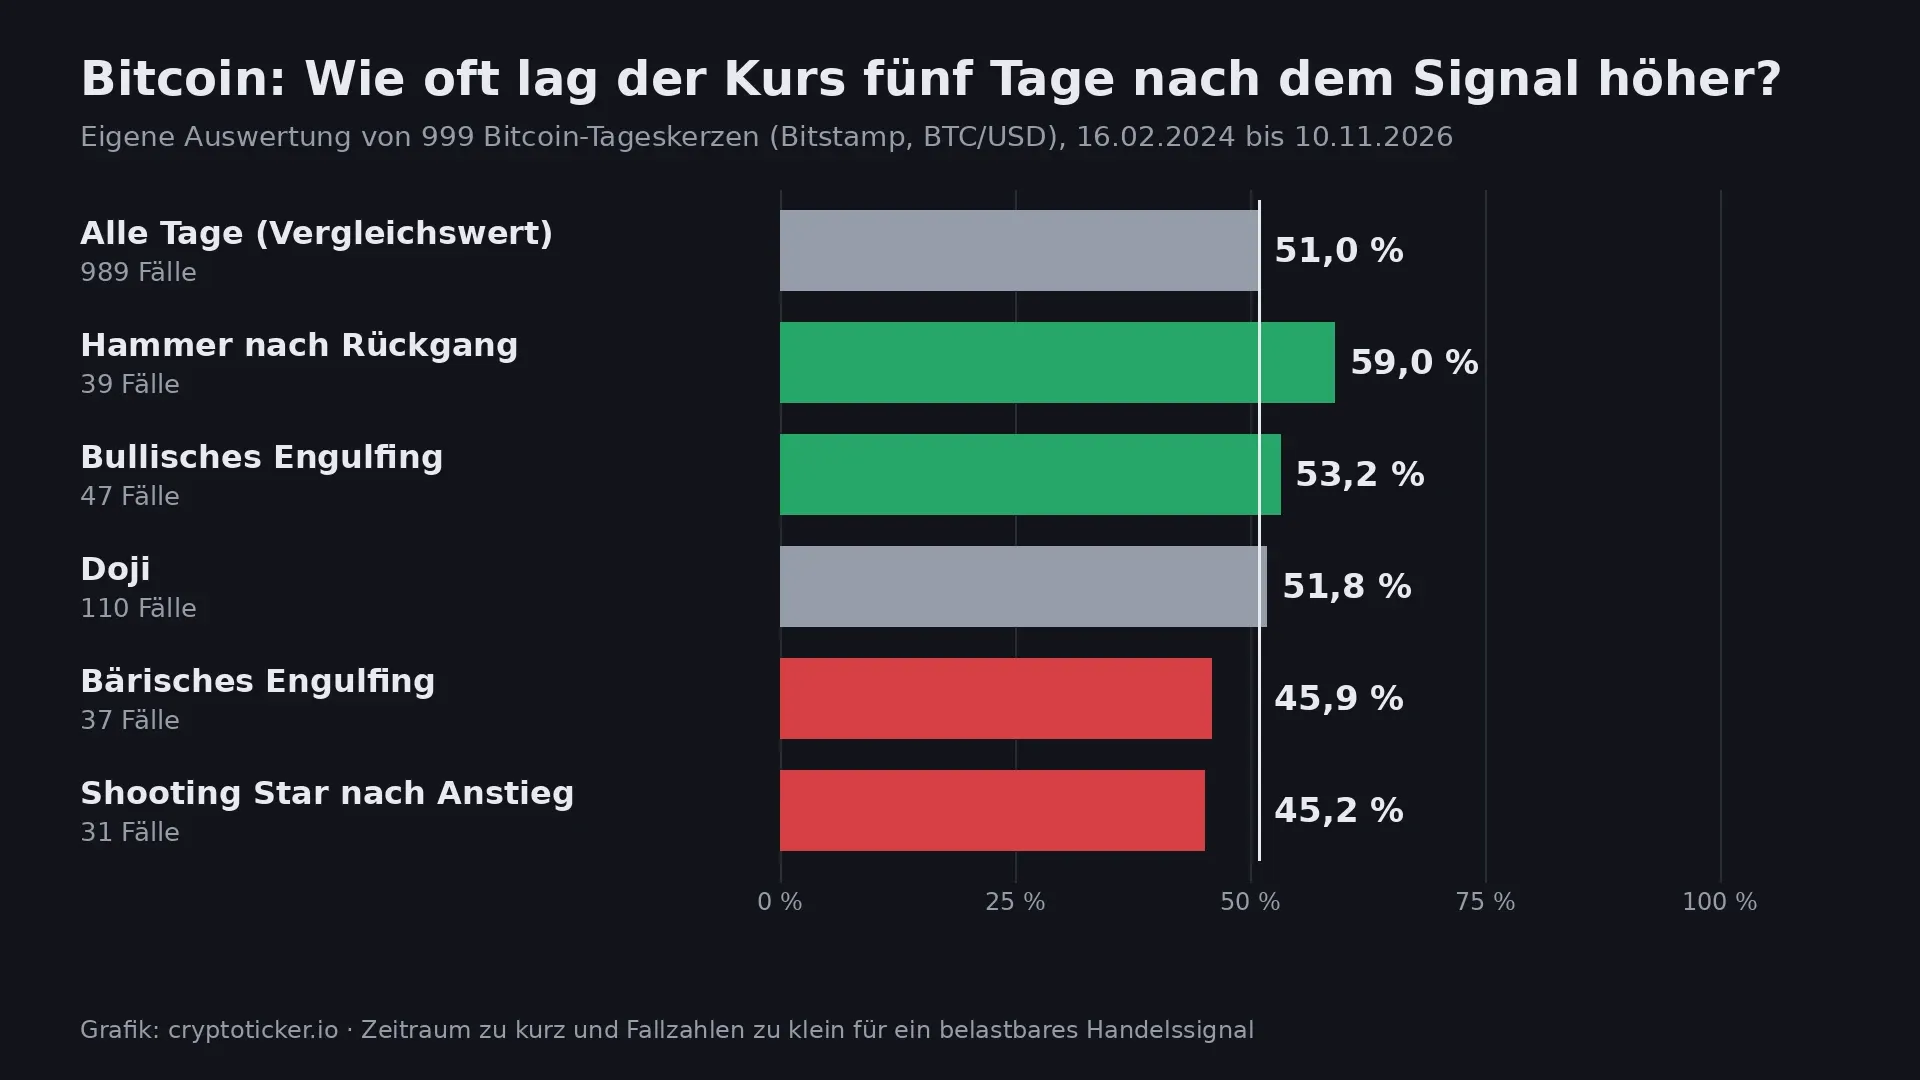
Whether the patterns are any use for bitcoin can be measured. To do so, we analysed the 999 daily BTC/USD candles on Bitstamp from February 16, 2024, to November 10, 2026. For each pattern, we counted how often the price five days after the signal candle was higher than at its close. The benchmark is the same share across all days.
The rules were simple and set in advance. A doji is a candle whose body makes up no more than a tenth of the range between high and low. A hammer has a lower wick at least twice the length of the body, a short upper wick, and follows a decline, measured by the close being below the close five days earlier. The shooting star is the counterpart after a rise. For the engulfing patterns, the new body has to fully enclose the old one and be longer.
The result: across all days, bitcoin was higher five days later in 51.0 percent of cases. After the 39 hammer candles, the figure was 59.0 percent, and after the 47 bullish engulfing patterns 53.2 percent. After the 31 shooting stars, the price was higher in only 45.2 percent of cases, and after the 37 bearish engulfing patterns in 45.9 percent. The 110 doji candles, at 51.8 percent, came in almost exactly at the average. On average, the price rose 1.29 percent in the five days after a hammer and fell 0.75 percent after a shooting star.
So the direction matches the textbook reading, but the gap to chance is small. With 39 cases, 59 percent amounts to a mere three more hits than the 51 percent average. With so few cases, a genuine edge cannot be told apart from luck, especially since trading fees and the spread between bid and ask further erode the advantage in real trading. In this test, the doji turns out to be exactly what its reputation suggests: a signal without direction.
Candlestick analysis in research: what a study of Dow Jones stocks found
Our small bitcoin test is not alone. In 2006, the economists Ben Marshall, Martin Young and Lawrence Rose examined in the Journal of Banking & Finance whether candlestick patterns could make money on the stocks of the Dow Jones Industrial Average. Their data set ran from 1992 to 2002. The study's title asks the question directly: "Candlestick technical trading strategies: Can they create value for investors?" The authors' answer was sobering: the three economists found no evidence that the candlestick signals they examined predicted the price moves of large US stocks.
That does not make candlestick charts worthless. Candles remain the clearest way to read price data: anyone who understands a candlestick chart grasps volatility, buying pressure and selling pressure faster than in any table. Problems only arise when a single pattern is treated as a reliable buy or sell signal. Neither the research nor our bitcoin analysis supports that expectation.
Where candlestick charts come from: the rice trade in Osaka
Candlestick charts are often traced back to the Japanese rice trader Munehisa Homma, who lived from 1724 to 1803 and traded on the Dojima rice exchange in Osaka. The English-language Wikipedia cautiously describes him as "sometimes considered the father of the candlestick chart". Whether Homma himself already drew candles or whether the method only emerged later is disputed among historians. What is documented is his reputation as a trader who closely observed the mood of market participants.
The method only became known in the West in the early 1990s, when the US analyst Steve Nison published his book "Japanese Candlestick Charting Techniques". Many of the Japanese names you read on crypto learning sites today, such as doji or harami, come from this tradition. Harami roughly means "pregnant", because the small candle sits inside the body of the large one.

Candlestick charts in crypto trading: common mistakes with leverage and one-minute candles
The most common mistake when reading candlestick charts is using too short a timeframe. On the one-minute chart, some pattern forms all the time; a hammer or doji turns up there several times an hour. The shorter the timeframe, the more random noise drowns out any signal. Anyone guided by patterns therefore looks at the daily or weekly chart first and only then at shorter periods.
The second mistake is trading patterns with leverage. A signal that in our analysis moved in the expected direction in six out of ten cases at best loses in four out of ten. With leverage, one such miss can wipe out a position entirely. How liquidations and margin calls work is explained in our guide to liquidations in leveraged trading.
The third mistake concerns the unfinished candle. As long as a period is still running, the candle keeps changing. What looks like a hammer in the afternoon can turn into a long red candle by the daily close. Candlestick patterns are therefore only assessed once the candle has closed. If you need price data, indicators and alert levels in one place, our comparison of crypto analytics platforms lists tools with candlestick charts, alerts and custom timeframes.
Candlestick analysis: trend and timeframe first, then the pattern
Candlestick charts are a tool for reading the market, not an oracle. Three steps help you get started:
- Use charts with clean data: choose a platform that offers candlestick charts in several timeframes, indicators and price alerts. Our comparison of crypto analytics tools gives an overview.
- Set the rules in advance: if you want to use patterns systematically, write down the conditions beforehand and test them on historical data, as in our bitcoin analysis. Such rules can be automated with trading bots, which our comparison of crypto trading bots sets side by side.
- Trade without leverage first: when making your first decisions, buy coins directly on the spot market of a regulated exchange and do without leverage. Fees and licences are shown in our crypto exchange comparison.
(As of November 11, 2026. This article is not investment advice. Prices and fee structures change; check the terms with the provider before you buy.)
0
0

 Manage all your crypto, NFT and DeFi from one place
Securely connect the portfolio you’re using to start.
 Where will Bitcoin trade next?
Live Polymarket and Kalshi odds on Bitcoin price targets, compared side by side.
See Bitcoin price odds


