
Price Prediction 10/12: BTC, ETH, BNB, XRP, SOL, HYPE

0
0

HYPE is trading in the red after a few hours of trading in the new week. The bulls have failed to sustain the upward momentum seen in the early hours of Monday.
Interestingly, the altcoin is among several assets experiencing notable declines following recent upticks. The global crypto market cap reflects this trend, with the metric printing a red candle at the time of writing.
Away from the broader market, HYPE ended the previous week with losses exceeding 4%, marking its third consecutive week of declines. Monday’s bearish start may indicate that selling pressure persists. However, it remains to be seen whether market conditions will improve in the coming days.
Meanwhile, HYPE and the broader crypto market are contending with the impending U.S. CPI report. Current forecasts for the Consumer Price Index point to persistent inflationary pressure. If the figures come in as expected, steeper declines could follow. However, investors may price in the data before Wednesday’s release, potentially triggering a recovery afterward.
Despite the slow start to the week, a closer look at the previous week’s performance reveals that some assets recorded notable gains. One such asset is NEAR Protocol, which has benefited from inflows into its spot ETFs.
However, the cryptocurrency is also facing notable selling pressure. Let’s examine how the situation could unfold for cryptocurrencies in the top 10.
BTC/USD
Bitcoin has been trading around $83,000 over the past few hours. This level is worth watching, as a break below it could leave the apex cryptocurrency vulnerable to further losses, potentially pushing it below $80,000.
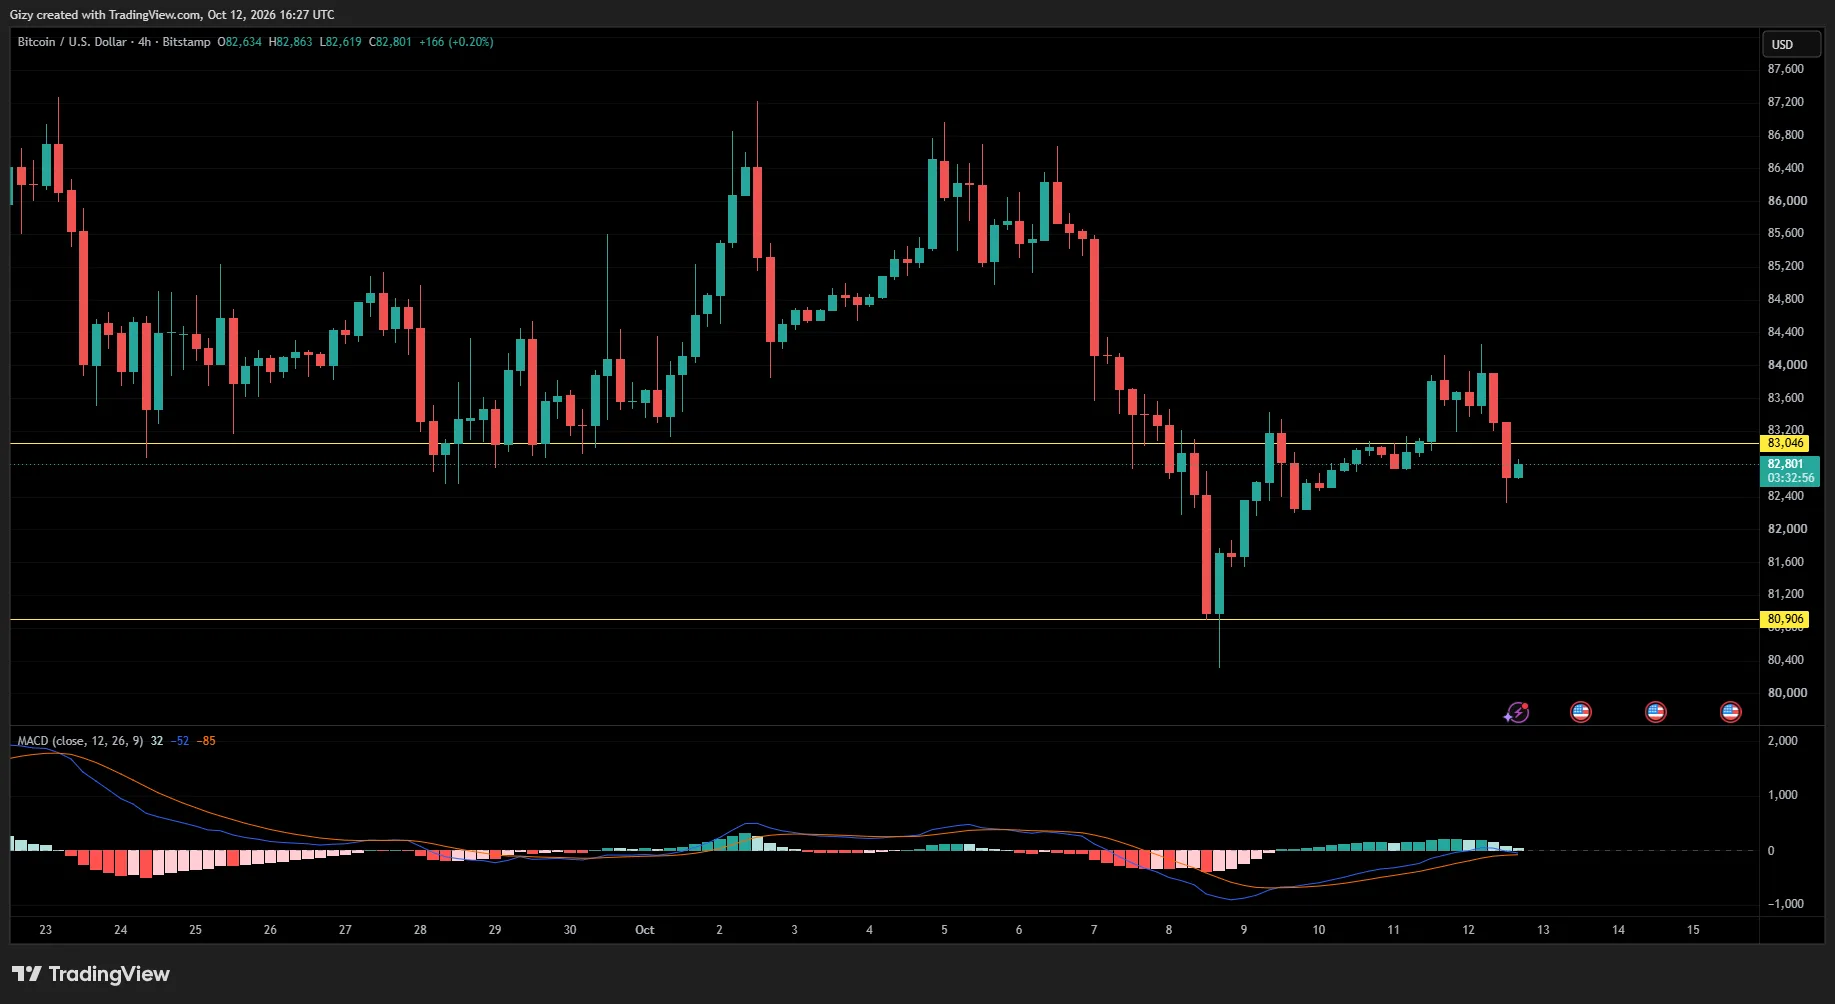
Nonetheless, BTC recorded a notable rebound over the past three days, gaining more than 3%. However, the recovery was insufficient to erase all the losses recorded during the first half of the previous week.
The upward momentum has since faded. A closer look at Sunday’s and Monday’s candles suggests the formation of a potential double top. If the pattern is confirmed by the end of the current session, it could signal renewed selling pressure ahead of Wednesday.
The four-hour chart supports this bearish outlook, with the MACD indicating a sell signal. A closer inspection also reveals a developing bearish convergence, suggesting that downside momentum may be strengthening.
If current conditions persist, BTC could retrace below $81,000 within the next two days.
ETH/USD
On the weekly timeframe, ETH recorded its largest loss since June, shedding approximately 7%. However, the candle’s long lower wick suggests that buyers stepped in to recover some of the losses before the weekly close.
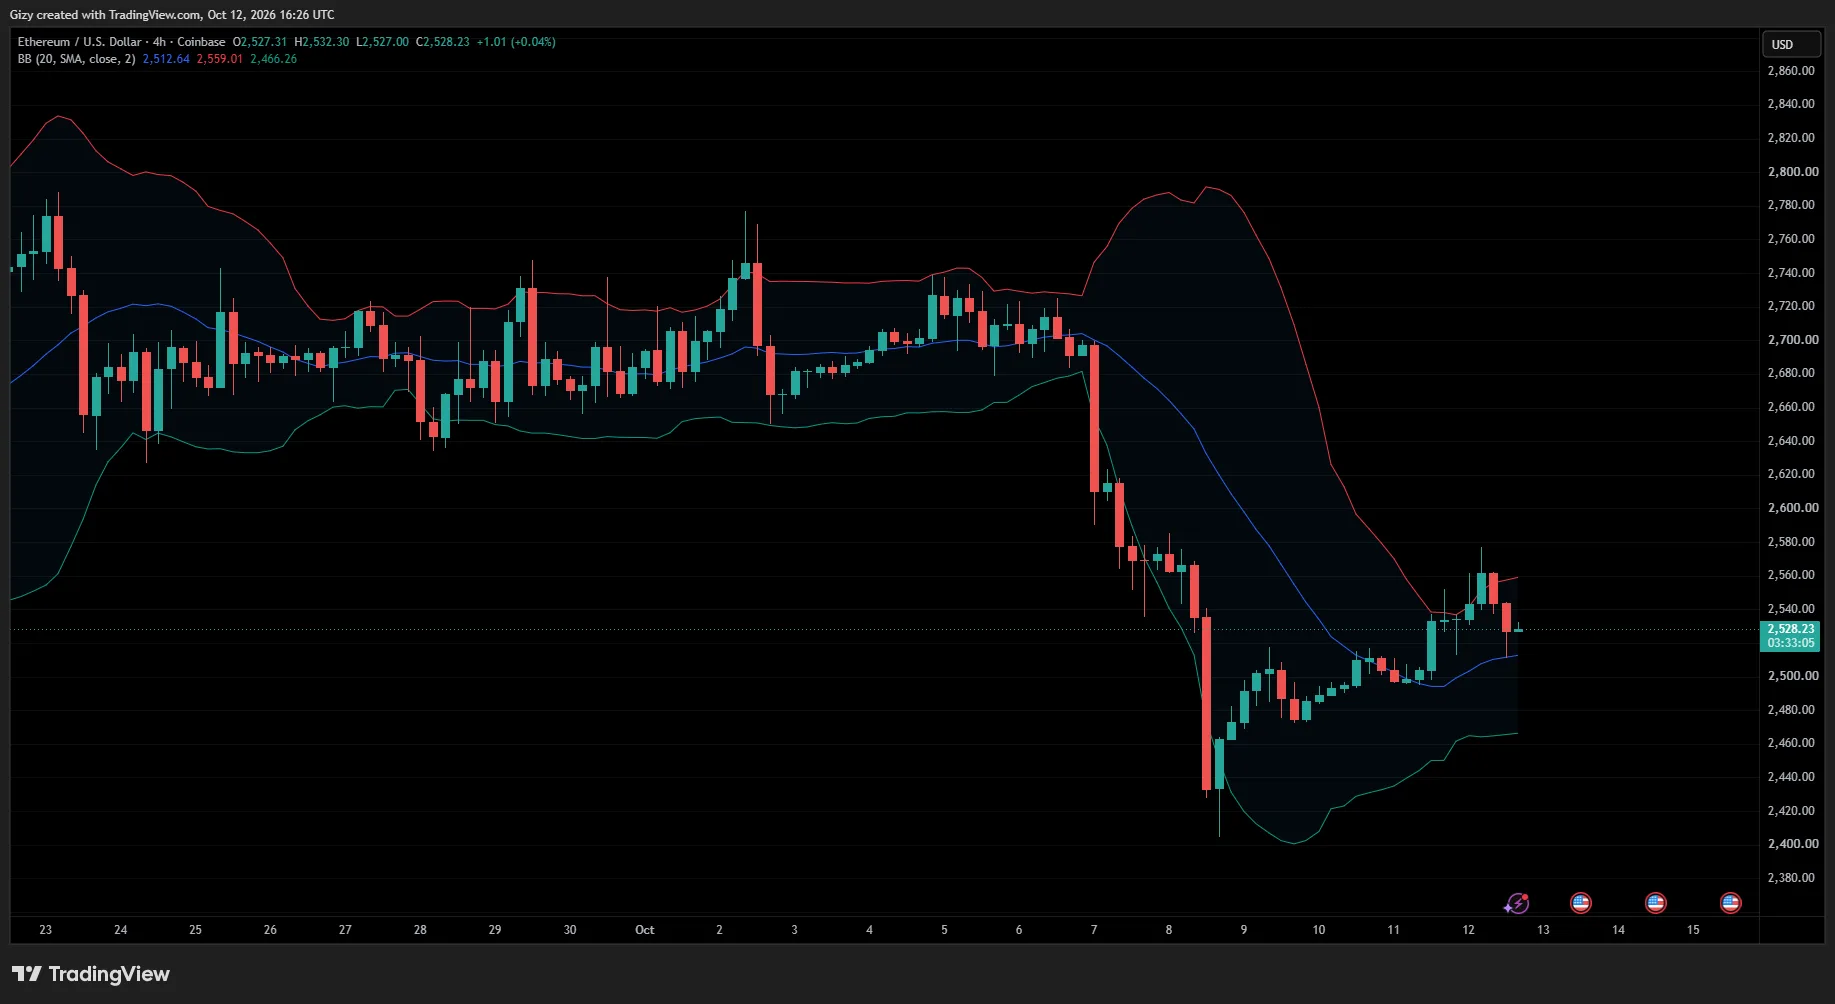
Like BTC, ETH recorded notable gains over the weekend, but the recovery was insufficient to reverse the broader downtrend. Current price action suggests that the upward momentum has faded. With the new week beginning on a bearish note, technical indicators are also turning negative. One such indicator is the Relative Strength Index (RSI) on the daily chart.
On the shorter timeframe, ETH is approaching a critical juncture. The asset recently retreated after testing the upper Bollinger Band and has continued to decline. However, it has since bounced off the simple moving average (SMA), leaving room for another recovery attempt.
If buying pressure strengthens, ETH could attempt to reclaim $2,600. Conversely, a further decline in demand could push the asset toward $2,440.
BNB/USD
Like HYPE, BNB is also trading in the red. Given its recent price action, the decline of less than 2% is worth watching and could precede further losses if selling pressure intensifies.
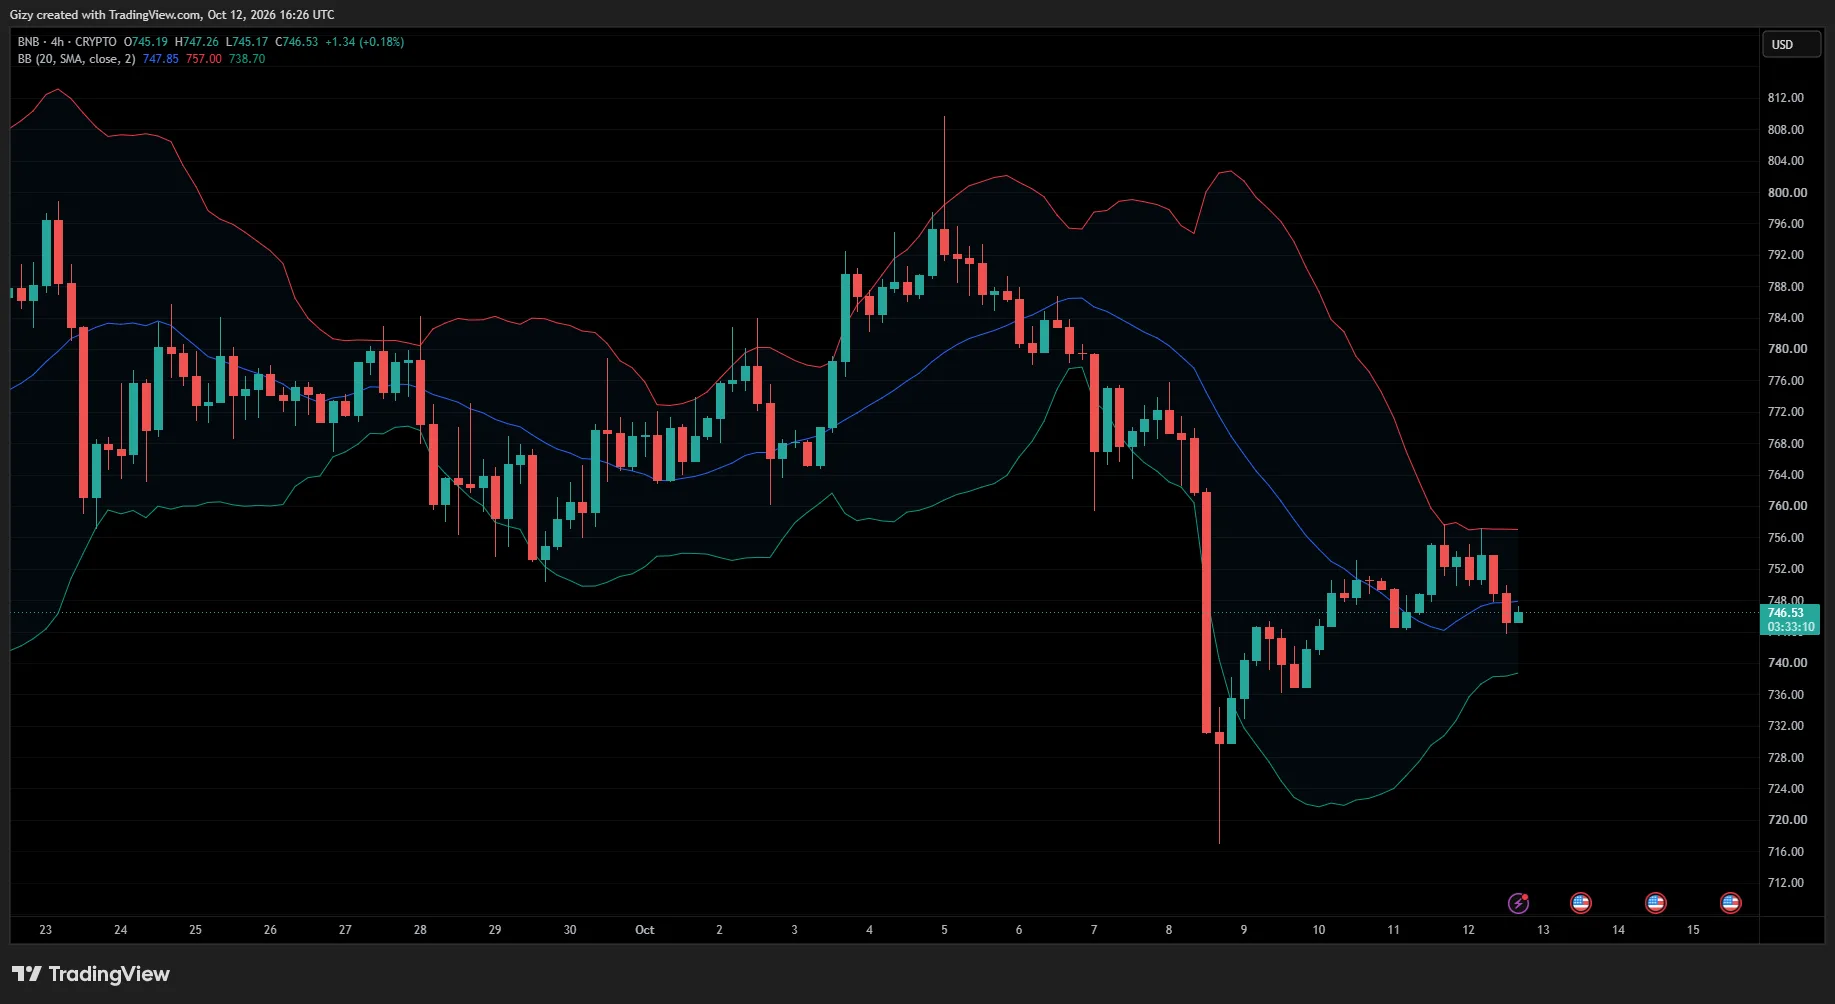
On the four-hour chart, the coin has printed a candle below the middle Bollinger Band, suggesting that bearish momentum is gaining traction and increasing the likelihood of further declines. Nonetheless, a rebound remains possible, with $745 emerging as a potential support level.
This would not be the first time BNB has rebounded from this level in the past three days. However, if buyers fail to defend it, the coin could drop by another $10–$15.
The Bollinger Bands also suggest that downside pressure could persist following BNB’s move below the middle band.
XRP/USD
XRP began trending downward after failing to decisively break above its pivot point. Despite three attempts, the altcoin continues to trade below this level, raising the possibility of a steeper decline.
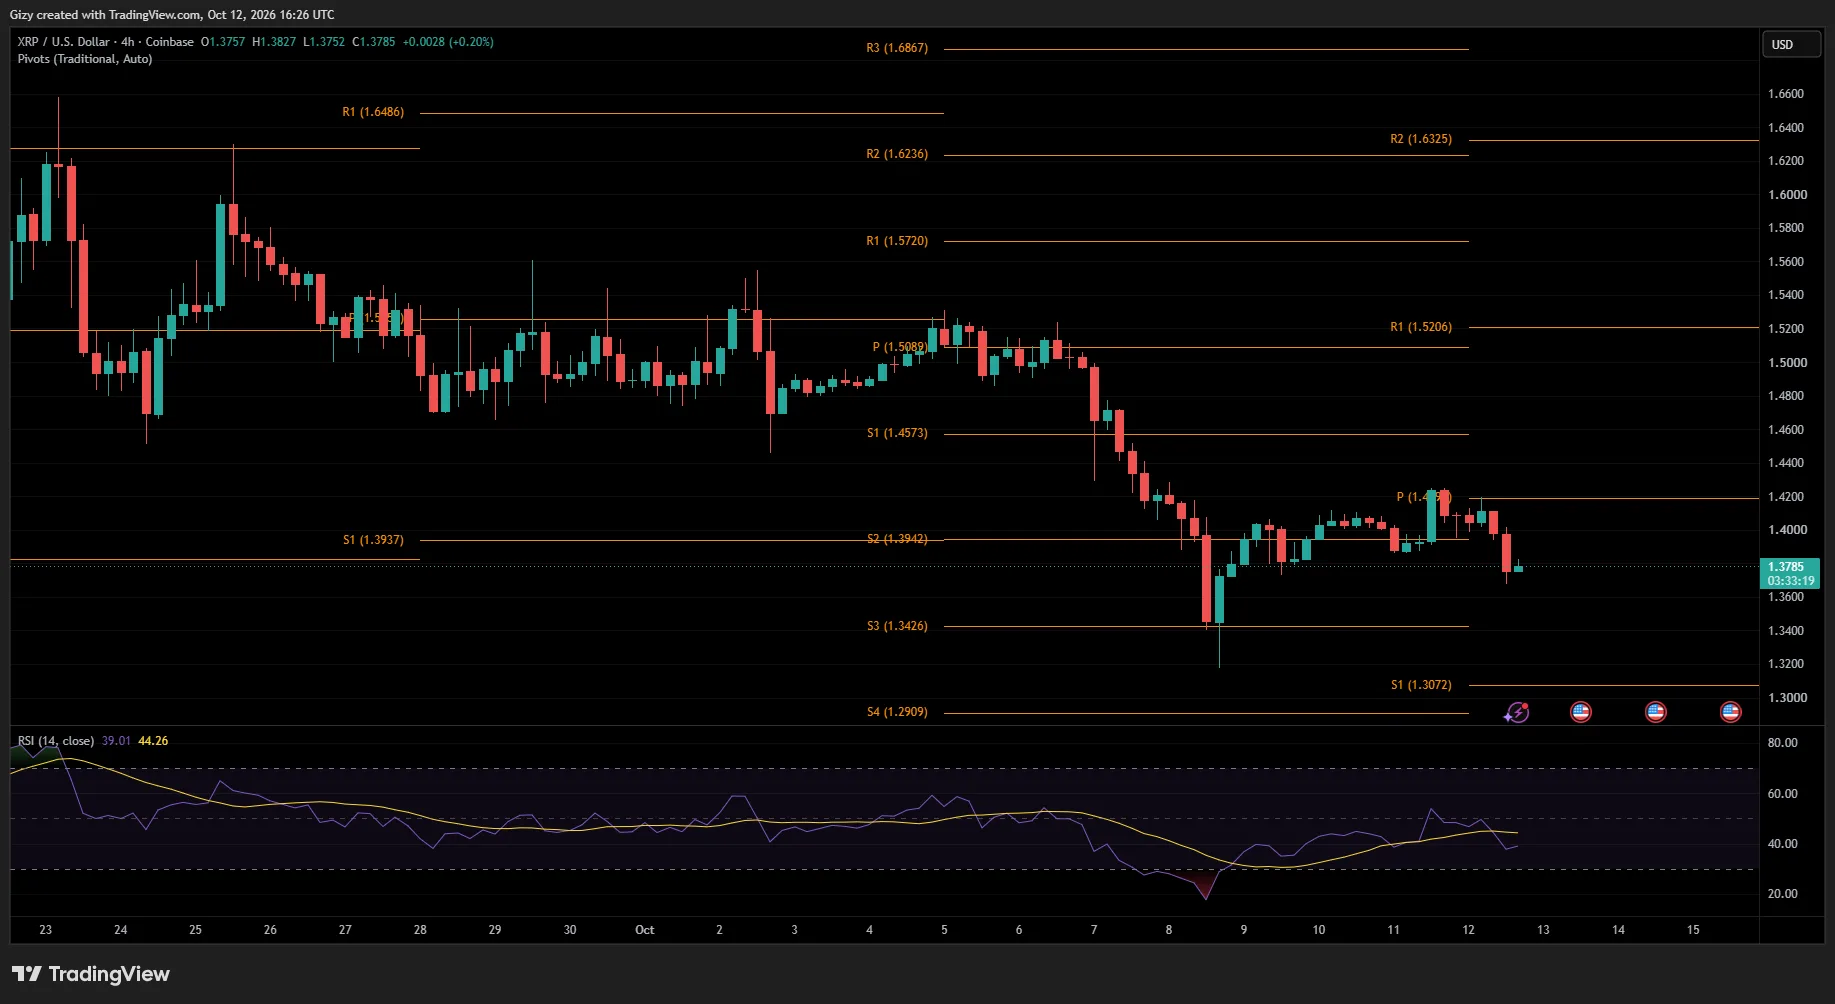
According to the standard pivot-point framework, a rejection at resistance could push the asset toward the next support level. In this case, that level is $1.30. However, XRP may not retest this mark before Thursday.
One reason for this assessment is that the altcoin is approaching oversold territory. A move into this zone could trigger renewed buying pressure and a potential rebound. Another factor working against further declines is the notable concentration of demand around the current price levels.
SOL/USD
SOL has lost almost 2% over the past four hours. While the decline is noteworthy, another important development is its rebound from $108. The latest candle features a small lower wick, suggesting that buyers stepped in at this level.
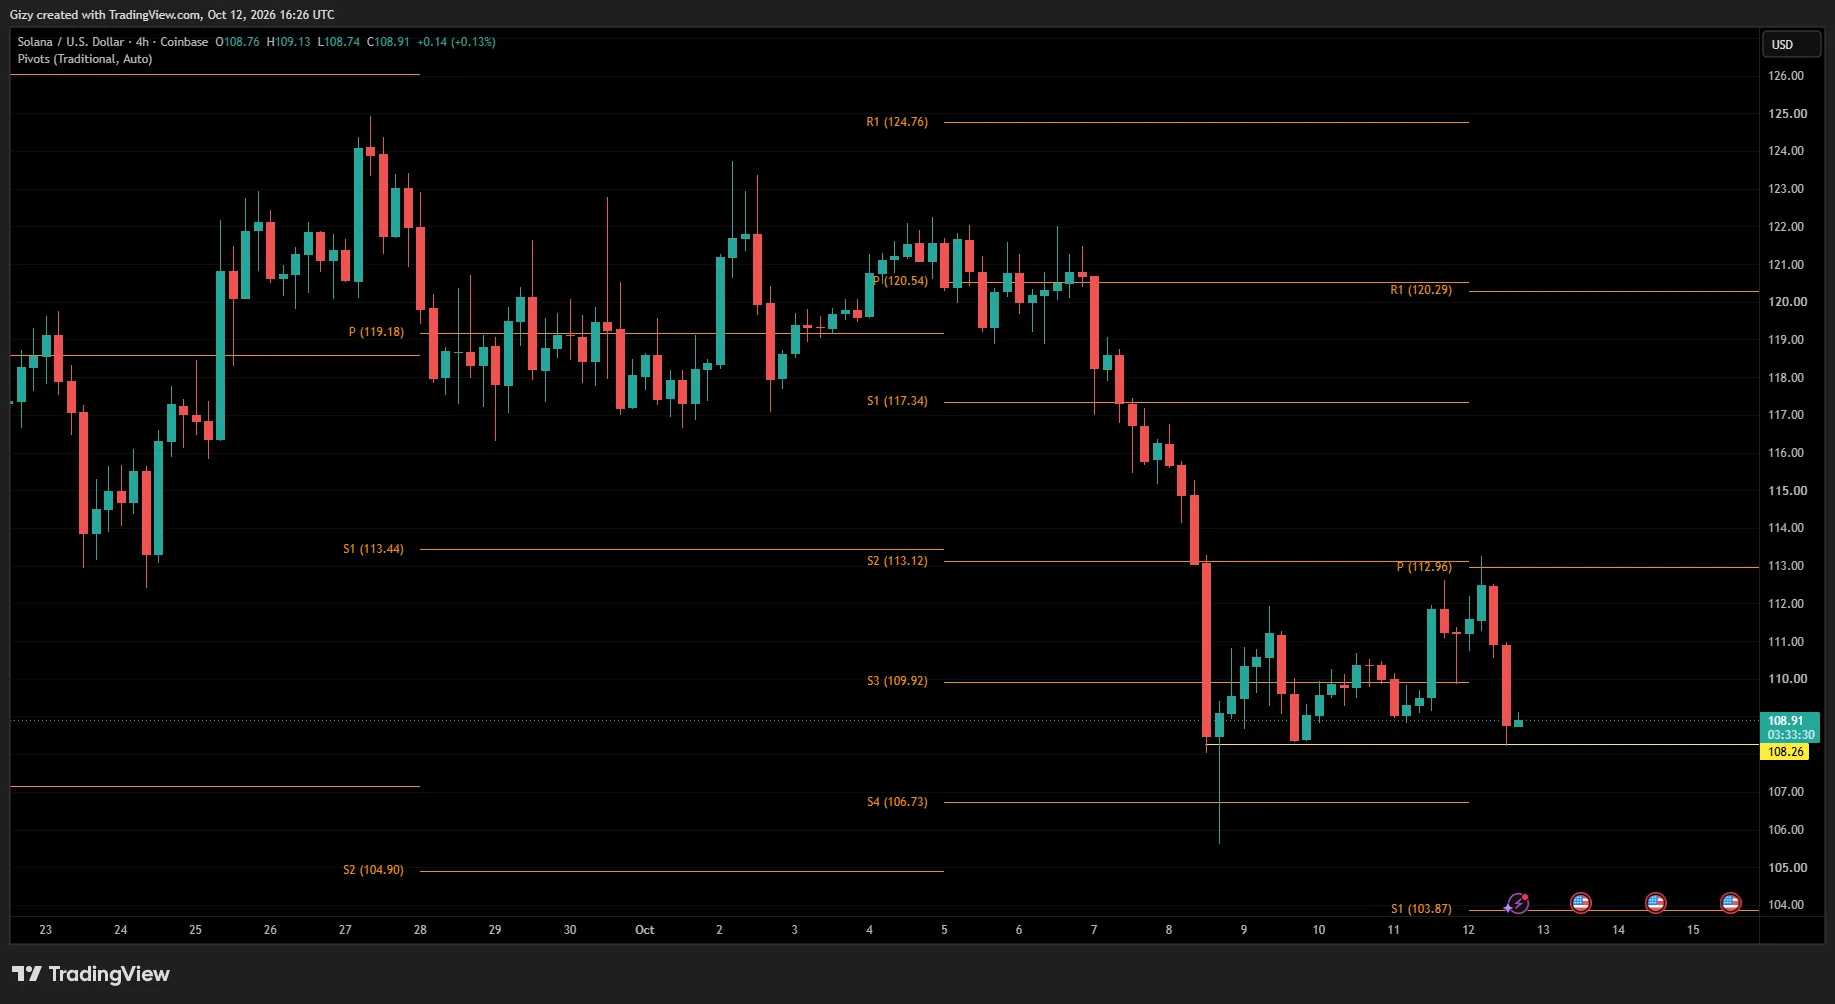
Looking back, the four-hour chart shows several instances in which SOL’s declines ended around this price. If the pattern repeats, the asset could attempt to reclaim $113. The daily chart also highlights the significance of this support level, strengthening the case for a potential rebound.
However, if the bulls fail to defend $108, further declines could follow. The Pivot Point Standard (PPS) indicator identifies $104 as the next potential downside target.
HYPE/USD
On the daily chart, HYPE has moved closer to its four-day support level. However, the small lower wick suggests that buyers are attempting to halt the decline. If this effort succeeds, the altcoin could recover its Monday losses by Tuesday.
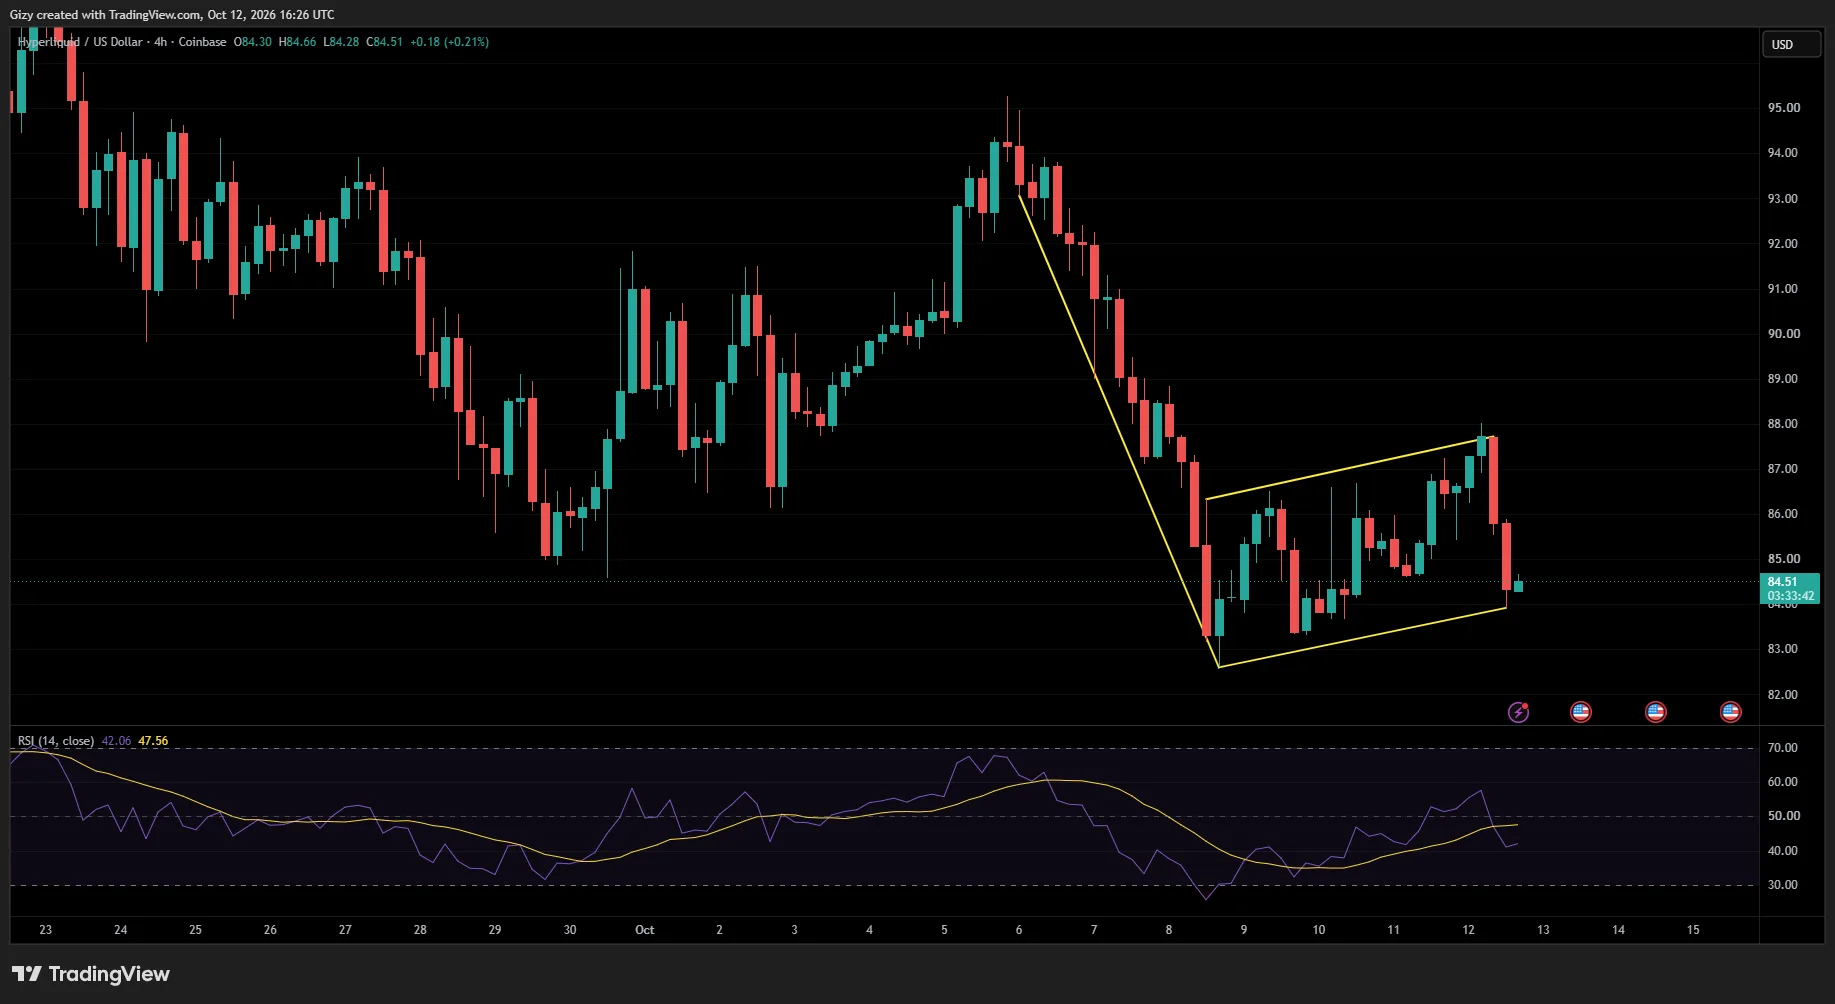
On the four-hour timeframe, HYPE appears to be trading within a bear flag. After an extended decline, the asset has entered an ascending pattern. In technical analysis, this structure can signal a temporary recovery within a broader downtrend, raising the possibility of another downward move.
However, the timing and extent of any potential breakdown remain uncertain.
While investors may anticipate a breakout to the upside, HYPE’s continued movement within the ascending pattern could see it attempt to reach $88 within the next two days. Whether the asset can sustain this recovery or resume its broader downtrend will depend on the strength of buying pressure and its reaction at key resistance levels.
The post Price Prediction 10/12: BTC, ETH, BNB, XRP, SOL, HYPE appeared first on CoinTab News.
0
0


 Manage all your crypto, NFT and DeFi from one place
Securely connect the portfolio you’re using to start.
 Where will Bitcoin trade next?
Live Polymarket and Kalshi odds on Bitcoin price targets, compared side by side.
See Bitcoin price odds


