
Shiba Inu daily turnover 75.8 percent below last year: Dogecoin trades twice as actively

0
0

The price of Shiba Inu stood at $0.00000504 on Wednesday evening, 3.0 percent below its level 24 hours earlier. The more interesting figure of the day is a different one: tokens worth roughly $63.5 million changed hands within 24 hours. Exactly a year ago, on October 14, 2025, the figure was $262.0 million. Turnover has therefore dropped by 75.8 percent, while market capitalisation over the same period fell from $6.333 billion to $2.979 billion, a decline of 53.0 percent. Both values come from the same CoinGecko daily series and are directly comparable.
That gap is the core of this article. A market whose turnover shrinks faster than its stock reacts more violently to the same amount of selling pressure. For holders and buyers in Germany, it decides how much an entry really costs and which order type makes sense.
Daily turnover stands at $63.5 million
The bare figures as of October 14, taken from the public interface of CoinGecko: Shiba Inu trades at $0.00000504, or €0.00000452. The daily low was $0.00000500, the daily high $0.00000523. Over seven days the token is down 6.2 percent, over 30 days 5.4 percent, and over a year 53.0 percent. Market capitalisation of $2.97 billion is enough for rank 38 in the overall market.
Daily turnover means the sum of all reported trading volumes on the venues covered within 24 hours, converted into dollars. It says nothing about whether buyers or sellers were in charge, only how much money moved at all. That is precisely why it is the better gauge of tradability than the price.
In quantities: of the 589.24 trillion tokens in circulation, roughly 12.6 trillion changed hands. Total supply is 589.50 trillion, so the difference of about 257 billion tokens is not in circulation.
Turnover ratio explains the price swings better than the price level
Divide daily turnover by market capitalisation and the result is the daily turnover ratio. It shows what share of the entire stock is traded in a day, which makes it a measure of a market's depth. On a seven-day average, that figure for Shiba Inu now stands at 2.26 percent. A year ago it was 3.10 percent.
The mechanism behind it is rarely spelled out, but it is simple. An order book holds only a limited quantity of bids at each price point. When a larger sell order arrives, it works its way down through those bids until it is fully filled. The less money sits in the book, the deeper it reaches. A sell order of $500,000 is noise at $262 million of daily turnover and a visible move at $63.5 million.
The range of the past year shows how widely this figure swings. The minimum was 1.83 percent on June 23, 2026, the maximum 7.39 percent on August 1, 2026. Today's reading of 2.26 percent therefore sits in the bottom third of the annual distribution.
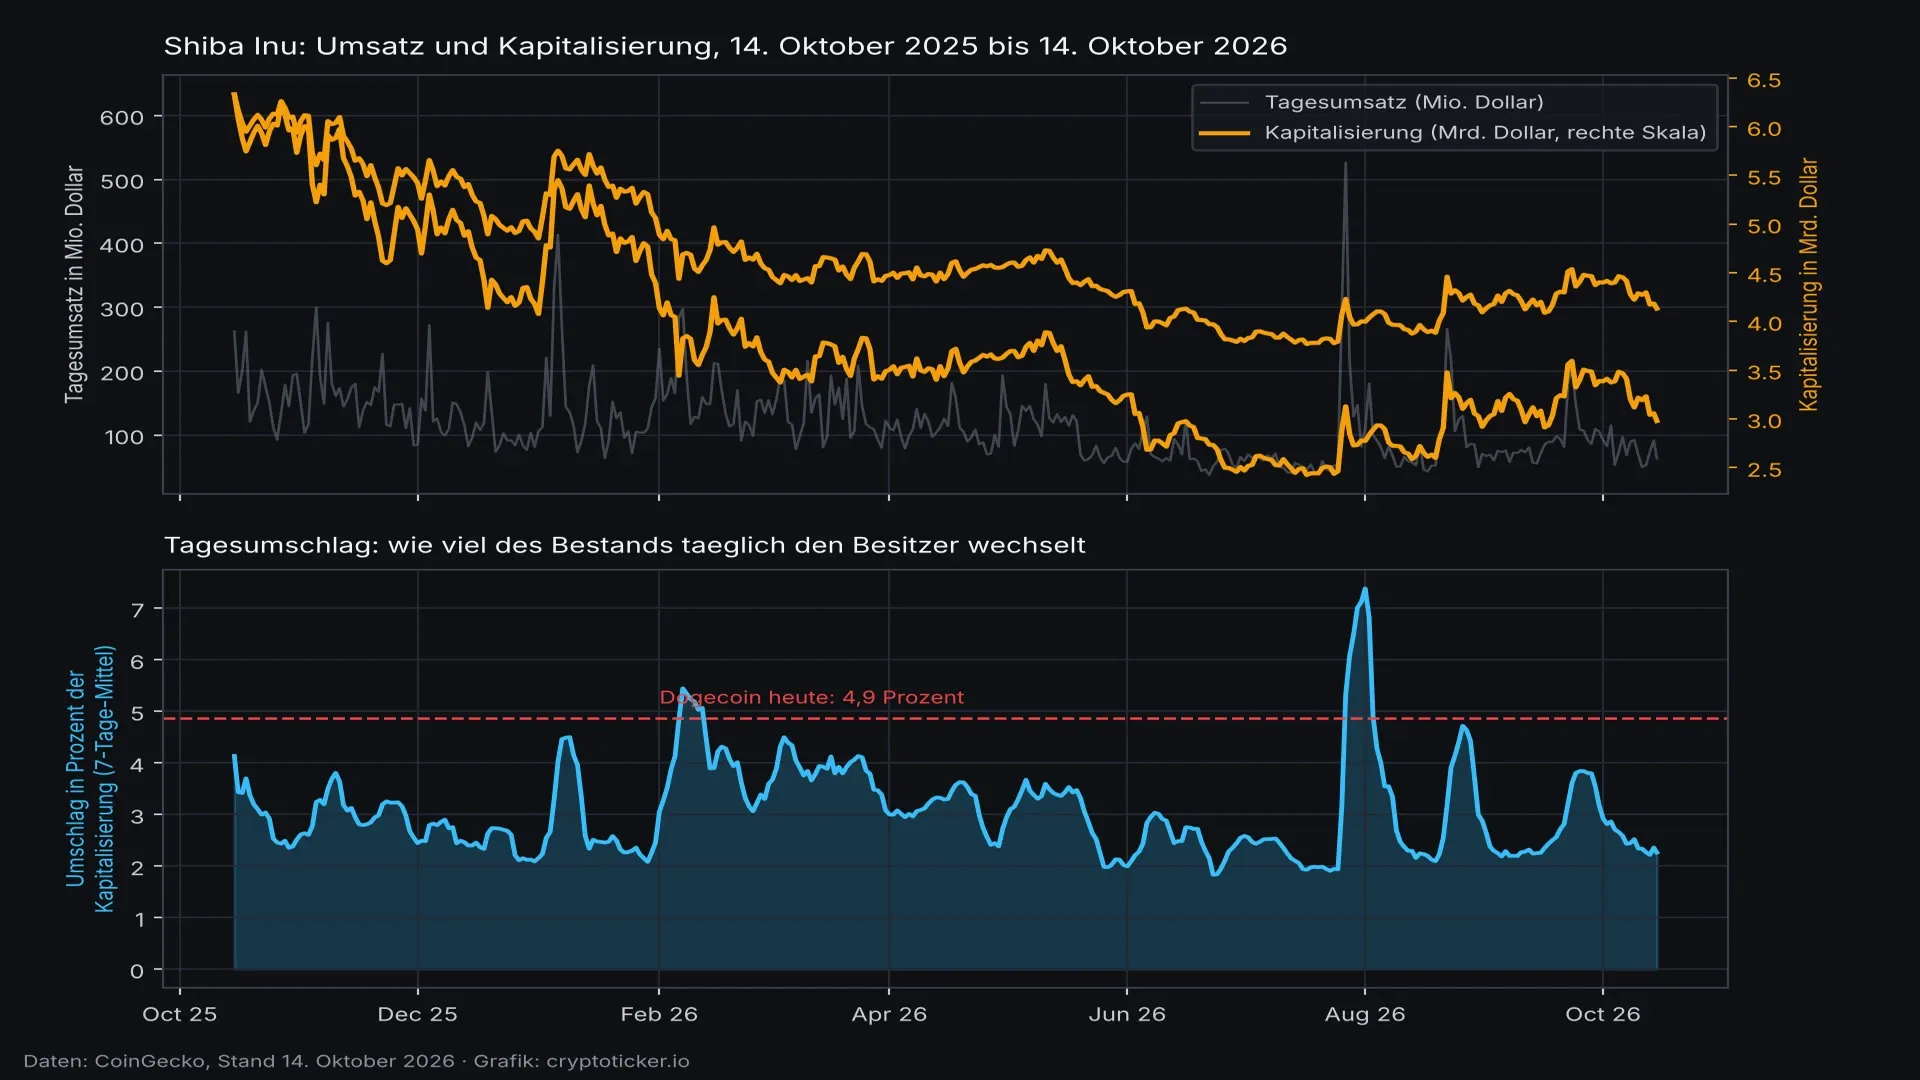
Shiba Inu against Dogecoin: 2.26 versus 4.87 percent turnover
The obvious comparison is with Dogecoin, the larger of the two well-known dog tokens. On a market capitalisation of $12.82 billion, Dogecoin posts a daily turnover ratio of 4.87 percent on a seven-day average, more than double the figure. A year ago Dogecoin stood at 8.96 percent and Shiba Inu at 3.10 percent.
One finding belongs alongside it, even though it disturbs the simple narrative: Dogecoin's turnover has fallen even harder year on year than Shiba Inu's, from $4,513 million to $648.8 million, a drop of 85.6 percent. Trading in memecoins has become quieter across the board, not just in Shiba Inu. The difference still holds: measured against its own stock, Shiba Inu now trades less than half as actively as Dogecoin.
US inflation of 3.7 percent hits thin markets first
The trigger for Wednesday's slide came from Washington. The US Labor Department published September consumer prices on Wednesday morning New York time. The annual rate rises to 3.7 percent from 3.4 percent in August, above the market forecast of 3.6 percent. Higher inflation lowers the odds of falling policy rates, and falling policy rates are the argument on which risk assets are usually bought.
How the market distributes that can be read off the daily changes. Bitcoin gave up 1.7 percent, Ethereum 3.1 percent, Solana 3.3 percent, Dogecoin 2.9 percent and Shiba Inu 3.0 percent. The order is no accident. Investors cutting risk sell first where the rationale is thinnest and the order book flattest.
Only 1.8 percent of global trading runs in euros
For investors in Germany there is a second point that disappears inside the global turnover figure. Of the roughly $62.0 million reported by the hundred largest trading pairs covered on Wednesday evening, 85.7 percent runs against the dollar stablecoin USDT. Next come the Turkish lira with 5.9 percent, the US dollar itself with 3.4 percent and the stablecoin USDC with 2.6 percent. The euro carries 1.8 percent, or about $1.12 million in absolute terms.
Buying in euros therefore means trading on a fraction of the market. That is no reason to switch to a dollar stablecoin, because the conversion adds a cost item of its own and holding a stablecoin brings its own questions. It is, however, the reason why the choice of venue carries more weight with Shiba Inu than with Bitcoin.
By venue, Wednesday evening's volume splits across KuCoin with 15.0 percent, Binance with 8.9 percent and BitDelta with 7.6 percent as the three largest. None of them accounts for more than a sixth of total turnover, so trading is widely scattered.
Spreads in the euro pair range from 0.04 to 0.66 percent
The gap between the bid and the ask, known in the trade as the spread, is the price you pay the moment you enter, before any fee applies. For Shiba Inu's euro pairs, venues reported widely differing values on Wednesday evening. Kraken and Bit2Me stand at 0.044 percent, Bitvavo at 0.077 percent, Coinbase and Bitstamp at 0.221 percent and WhiteBIT at 0.661 percent.
Between the tightest and the widest of those readings sits a factor of 15. On an order of €1,000 that is €0.44 at one end and €6.61 at the other. These values are snapshots of a single pair and not a fee schedule; they move during the day and say nothing about order fees, deposit and withdrawal routes or custody. The terms side by side are in our crypto exchange comparison.
What the thin order book means for the order type
A market order takes the best available price and, if needed, works further down the book. In a thin book that is exactly what gets expensive. A limit order fixes the highest price you pay and accepts in return that it may go unfilled. At a turnover ratio of 2.26 percent, that trade-off is usually the cheaper one. The same applies in the other direction: a larger position is better split across several orders than sent into the book as one market order.

Where the price stands since the October 13 low
On Tuesday we described the lowest daily level since September 18 in this slot. The price has not recovered since; it has slipped further, from a daily average of $0.00000516 on October 13 to $0.00000504 on Wednesday evening, a decline of 2.4 percent. The round level of $0.00000500 was reached exactly during the session and has held so far.
What has shifted above all is trading activity. Daily turnover still stood at $73.7 million on October 13, above today's reading, even though the price marked a low that day. A falling price alongside falling turnover points less to broad selling pressure than to absent buyers.
Shibarium still holds $48,511 in locked capital
Shibarium, the project's own blockchain, is what Shiba Inu bases its claim to be more than a memecoin on. The capital locked in it, counted in the industry as total value locked, is put at $48,511 by DefiLlama on October 14. For scale: Ethereum reaches $50.29 billion in the same survey, Solana $5.96 billion.
That figure does not explain the turnover ratio, but it belongs next to it. Trading in Shiba Inu takes place almost entirely on centralised venues rather than on its own blockchain. To judge tradability, look at the order books, not at Shibarium.
The one-year deadline under Section 23 of the German Income Tax Act and loss offsetting
With a one-year loss of 53.0 percent, many German investors are holding their position under water. For tax purposes, the purchase date is then the most important number in the portfolio. Crypto assets count as other assets in Germany, and their sale falls under private disposal transactions governed by Section 23 of the Income Tax Act.
That deadline cuts both ways. Sell within a year of buying and a gain is taxable as soon as the total of all private disposal transactions in that year reaches the €1,000 exemption threshold. A loss from that period can be offset against gains from other private disposal transactions in the same year and, on application, carried forward or back. Once the year has passed, a gain is tax-free, and the same sentence holds in the other direction: a loss is then disregarded for tax purposes too.
Which records the tax office wants to see
You have to document the purchase date, purchase price, quantity and sale for each individual transaction. With several purchases of the same token, the allocation of the units sold is added on top, in practice usually under the first in, first out method. With Shiba Inu, where amounts run to the eighth decimal place and small top-ups are often numerous, that is hard to manage without ongoing records. Which tools pull this history out of the venues is set out in our overview of crypto tax software. This section is no substitute for tax advice, and assessing an individual case remains the tax office's job.
Our assessment: the turnover ratio is the risk, not the price level
From the editorial team's point of view, the most important number of the day is not the 3.0 percent decline but the turnover ratio of 2.26 percent. The evidence is above: a 75.8 percent drop in turnover against a 53.0 percent drop in market capitalisation year on year, a 1.8 percent euro share of global trading, and a factor of 15 between the tightest and the widest euro spread. That means executing an order in Shiba Inu currently costs or saves more money than the question of whether you enter two percent higher or lower.
Against that view stands the fact that a turnover ratio of 2.26 percent is no historical outlier. It already sat at 1.83 percent in the past year, and the market then turned back to 7.39 percent. A thin market moves faster in both directions, not only down. No statement about where the price is heading follows from these figures, and we are not making one.
Thin trading: at a 2.26 percent turnover ratio, the order type decides
Three steps that follow from the figures in this article:
- Check your venue's spread before the order goes in. Between 0.044 and 0.661 percent in the euro pair, an order of €1,000 carries a difference of a good €6, and it falls due again on every purchase and every sale. The terms are in the crypto exchange comparison.
- Work with limits and split larger amounts. In a book that turns over 2.26 percent of its stock a day, a market order runs through several price steps faster than in a liquid market.
- Look up the purchase date of every position. It decides whether a loss can still be offset against gains in the same year. The tools for that are in the overview of crypto tax software.
(As of October 14, 2026. This article is not investment advice. Prices and fee structures change; check the terms with the provider before you buy.)
0
0


 Manage all your crypto, NFT and DeFi from one place
Securely connect the portfolio you’re using to start.


