
Bitcoin, Ether, XRP Selloff Triggers $1.6B in Crypto Liquidations

0
0
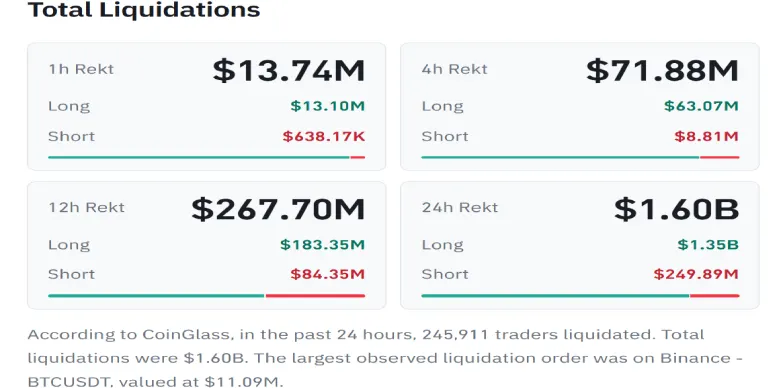
The global cryptocurrency market cap dropped 2.89% in the last 24 hours to $2.6 trillion, recorded during Friday’s U.S. market. Major cryptocurrencies, including Bitcoin, Ether, and XRP, are down 3%, and the broader crypto derivatives market faced over $1.5 billion in liquidations. The key catalyst that fueled this sell-off was a major security breach targeting the largest cryptocurrency exchange, Binance, impacting an estimated $6.3 billion in digital assets.
Binance hit by $6.3B security exploit linked to North Korea
The cryptocurrency market is experiencing a massive wave of panic-selling following the largest security exploit in crypto history targeting Binance. The exchange confirmed a catastrophic security breach affecting $6.3 billion in assets, which blockchain analytics firm TRM Labs has linked to North Korea’s elite “TraderTraitor” hacking unit. The panic, along with a wider tech sell-off, saw more than $1.6 billion in leveraged futures wiped out in just 24 hours as major technical levels fell.
In response to the exploit, Binance has temporarily suspended all withdrawals to secure the network. However, Binance co-CEO Richard Teng assured users on social media: “Bottom line: your money is safe, and we’re covering every loss.” The company said there was no evidence that wallet private keys were leaked, and that it will cover all user losses out of its corporate reserves.
Ecosystem partners quickly contained the damage, with approximately $3 billion frozen on-chain to date. This includes stablecoin giants Tether and Circle, who coordinated to freeze nearly $2.4 billion of the stolen funds. Binance anticipates resuming withdrawal operations in the next 48 hours while maintaining close links with law enforcement.
The financial backstop of the exchange has reduced immediate losses, but it faces a significant impact on ecosystem liquidity.
Bitcoin Price Loses Key Monthly Support
Over the past six weeks, the Bitcoin price consolidated in a narrow range between $87,000 and $79,500. The lateral trend initially indicated the formation of a bull flag pattern that could recuperate the bullish momentum for the next recovery.
However, the BTC price gave a bearish breakdown below this support by 4% on Thursday, weakening the bullish thesis. By press time, the coin price trades at $77,351, holding its foot above the 200-day exponential moving average. The dynamic support could push the price back to $79,300 and retest this breakdown before further movement.
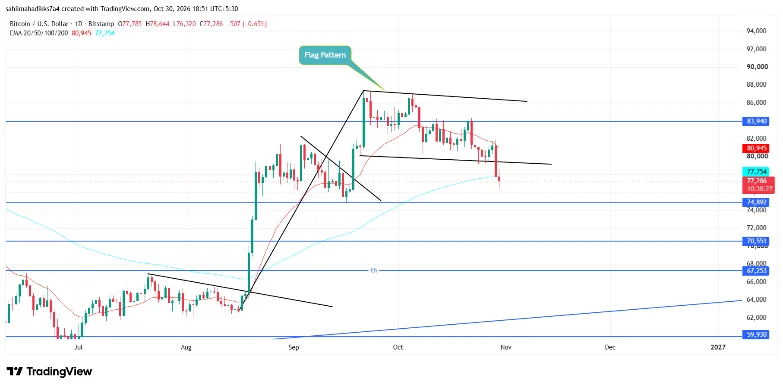
If the breakdown holds, the Bitcoin price could drop to $70,500, followed by $67,252.
Ethereum Price Gives Major Breakdown Below Head and Shoulders.
Similarly to Bitcoin, Ethereum price witnessed a notable consolidation above the $2,353 support. However, this sideways trend developed to the classic bearish pattern called head and shoulders (H&S), as shown in the chart below.
On October 25th, the Ethereum coin gave a bearish breakdown below the pattern’s neckline support, and Thursday’s neckline support gave a suitable follow-up for sellers. With sustained selling, the altcoin could slide another 11% and test the next significant support at $1.965.
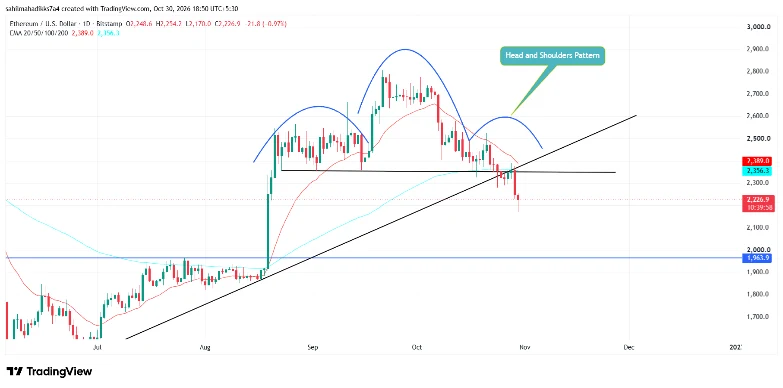
On the contrary, if ETH price could show a temporary rebound to $2,350 and retest the sustainability of this breakdown. A price move above the horizontal level could invalidate the bearish thesis.
XRP Price Retains Breakout Opportunity With Wedge Pattern
In line with the broader market sell-off, the XRP price gave a bearish breakdown below the monthly support of $1.254 on Thursday. This breakdown would tighten the sellers’ grip over this asset and drive a prolonged correction in price.
However, the XRP price holds at the $1.24 level with a neutral candle on the daily chart, as the lower trendline of a falling wedge pattern offers necessary support. The chart setup is characterised by two converging trendlines that reflect the weakening bearish momentum.
Until the overhead trendline is intact, the XRP price could extend its correction and potentially hit $1.16.
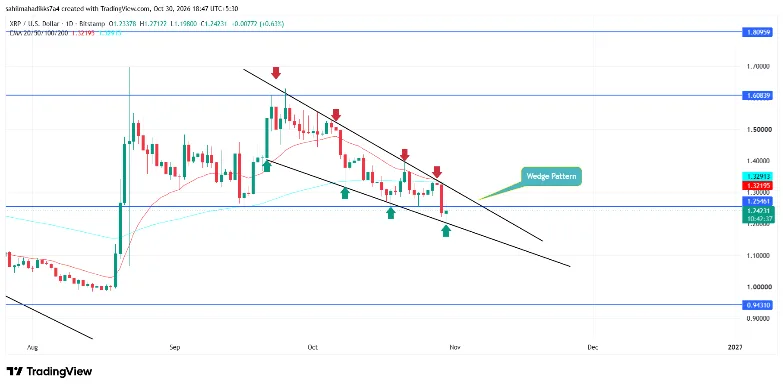
However, a bullish breakout from the overhead trendline could signal a change in market sentiment.
0
0


 Manage all your crypto, NFT and DeFi from one place
Securely connect the portfolio you’re using to start.
 Where will Bitcoin trade next?
Live Polymarket and Kalshi odds on Bitcoin price targets, compared side by side.
See Bitcoin price odds


