
Can PIEVERSE Hold $1.92? Pieverse Price Prediction After a Jump

0
0

Can PIEVERSE keep $1.92 after a jump of 13% to 17% in one day?
That's the question behind every Pieverse price prediction right now. Traders who follow latest crypto price predictions will find a setup that's strong on the surface and thin underneath.
This Pieverse price forecast pulls from CoinMarketCap, CoinGlass, BscScan and a MEXC daily chart, all checked on Nov 15, 2026, at 04:25 UTC.
PIEVERSE Price Today and Market Data
According to CoinMarketCap data, the PIEVERSE price today is $1.95, up 16.93% in 24 hours. It ranks 73rd. CoinGlass shows $1.924 and +13.30%, and the gap comes from different data windows.
Market cap is $586.82M. Volume, the amount traded in a set period, reached $78.46M, up 82.41%.
FDV, which values all 1B tokens at today's price, is $1.96B. Only 300.35M circulate, so about 700M tokens sit outside the market.
But liquidity, meaning how easily orders fill without moving price, is thin. CoinMarketCap puts it at 0.45% of market cap.
The record high is $2.22 from Nov 10, 2026, and $1.95 sits 11.88% under it.
Why Is PIEVERSE Moving Today?
PIEVERSE is up. Spot volume jumped 282.78% to $34.94M. Futures volume rose 105.91% to $246.15M, per CoinGlass derivatives data.
Futures trade about 7 times more than spot.
Open interest, the total value of open futures positions, climbed 20.02% to $84.90M. Funding rate, the fee longs pay shorts, sits at 0.0280%.
And liquidations stayed small. Shorts took 63% of $351.67K, so no squeeze happened.
Spot saw $2.0M of net outflow, and futures took in $6.3M. Rising open interest sounds bullish. Then again, spot buyers aren't leading, so the green candle is shakier than it appears.
So who's buying at $1.92? Mostly futures traders.
PIEVERSE Technical Analysis on the Daily Chart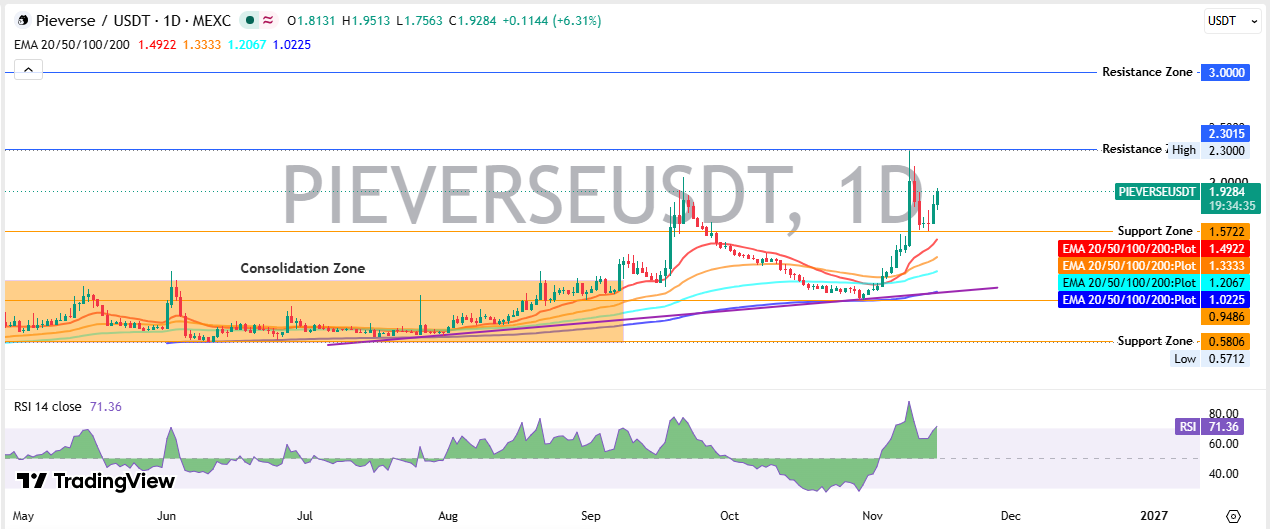
This Pieverse technical analysis uses the MEXC PIEVERSE/USDT chart on TradingView daily charts, where every candle opens.
Pieverse Price Analysis From the Range to Today
May through early September was a sideways stretch, called a consolidation zone, with the price holding above $0.5806. A rising trendline, which connects higher lows, guided the bottom.
Early September brought the breakout, a move out of the range, and PIEVERSE climbed to about $2.00.
Then sellers took over. October pushed price under the 20 EMA and 50 EMA, which are exponential moving averages that weight recent days more. The slide ended near $0.9486, where the trendline and the 200 EMA met.
November started the second leg. Price jumped from about $0.95 to a $2.30 spike in days, and RSI, a 0 to 100 gauge of how stretched a move is, shot above 80.
The pullback from $2.30 ran about 32% and stopped at the $1.5722 support zone, a level where buyers had defended the price before.
Today's candle opened at $1.8131, traded between $1.7563 and $1.9513, and traded at $1.9284, up 6.31%.
RSI, EMA and Key Levels
RSI sits at 71.36. Above 70 counts as overbought, which means buyers pushed hard and a pause is due.
The 20 EMA, 50 EMA, 100 EMA and 200 EMA sit at $1.4922, $1.3333, $1.2067 and $1.0225, stacked in bullish order. Price trades above all four.
But resistance, a level where sellers have stepped in before, waits at $2.00, $2.22, $2.30 and $3.00.
PIEVERSE Holder Concentration on BscScan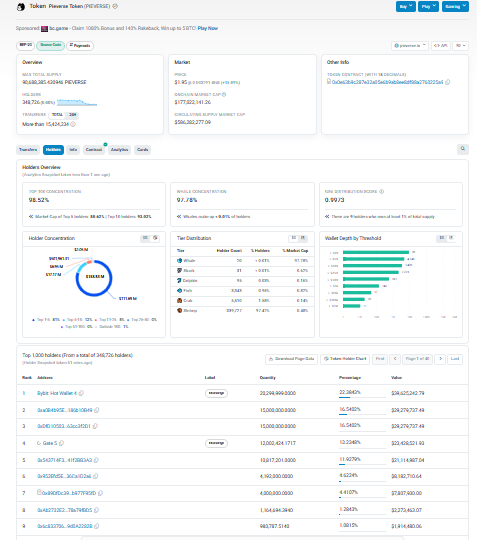
BscScan holder data lists 348,726 holders, yet the top 100 wallets control 98.52% of supply on that chain.
A Bybit hot wallet holds 22.38%, and a Gate wallet holds over 12%.
Exchange balances are mostly customer deposits, not sell orders. And a handful of wallets still decides how deep any dip gets.
Bitcoin and Market Mood Around PIEVERSE
Bitcoin trades at $64,808.31, down 2.91%.
Fear and Greed sits at 12, Extreme Fear.
PIEVERSE rose while Bitcoin fell. That's relative strength, and it fades fast if Bitcoin breaks lower.
Risk appetite in small tokens often shows up first in memecoin crypto news. But Altcoin Season sits at 42, short of the 75 mark that confirms a broad altcoin rally.
Pieverse Price Forecast and Scenario Table
Scenario | Trigger | Target | Invalidation | Liquidity Condition |
Bullish | Trades above $2.00 | $2.22, then $2.30 | Trades under $1.5722 | Spot volume rises |
Base | RSI cools from 71.36 | $1.5722 to $2.00 range | Breaks $2.30 or $1.4922 | Volume steady near $78M |
Bearish | Trades under $1.5722 | $1.4922, then $1.3333 | Reclaims $1.92 | Longs unwind, volume drops |
The Pieverse price projection favours the base case first. A range between $1.5722 and $2.00 fits a rally built on futures and an RSI of 71.36.
This Pieverse price prediction stays bullish above $1.5722, though not cleanly.
Pieverse Price Outlook After $2.00
A clean trade above $2.00 on rising spot volume opens at $2.22 and the $2.30 spike high. $3.00 needs $2.30 cleared first.
Daily trading under $1.5722 flips the setup. A fall below the 200-day EMA at $1.0225 puts $0.9486 back in play.
Fresh listings add buyers and depth. Traders can track them through exchange listing updates, because thin books move prices fast.
Risks That Can Change the Pieverse Price Prediction
Funding at 0.0280% means longs pay to stay in, and that cost builds if the price stalls.
A Bitcoin drop under $64,808.31 would hit small tokens first. Sector headlines move thin tokens fast too, so traders also check AI crypto news.
Disclaimer. This article is for information only and isn't financial advice. Crypto prices swing fast, and losses can be total.
0
0

 Manage all your crypto, NFT and DeFi from one place
Securely connect the portfolio you’re using to start.


