
Chainlink Price Prediction: Can Hanwha Offset the Binance Hack?

0
0

Can a Korean brokerage deal calm traders spooked by an exchange hack? That's the tug of war pulling Chainlink around right now.
Bullish headlines and bearish pressure landed within hours of each other, with the LINK:NYC keynote preview already a day old. This Chainlink price prediction separates the noise from the levels that matter.
Binance Hack Rattles LINK Price Today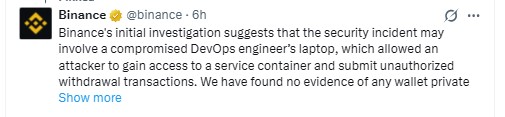
Binance's statement points to a compromised DevOps laptop that let an attacker submit unauthorized withdrawals.
Estimated impact sits near $6.3B, with about $3B frozen on-chain. Deposits and withdrawals are paused.
The Binance hack hit the exchange that handles the most LINK trading, and the LINK price today is down 3.28% over 24 hours. Binance says no wallet private key leaked.
Hanwha Chainlink Partnership and NYC Keynote
Chainlink said Hanwha Investment & Securities, a Fortune Global 500 affiliate, is adopting CCIP and Chainlink data standards for tokenization, per Chainlink's Hanwha post.
The Hanwha Chainlink partnership followed Sergey Nazarov's keynote, which pitched Chainlink as the bridge between banks and DeFi. LINK: NYC speakers on October 29, 2026, included DTCC, Swift, ICE, and BlackRock.
Korea Keeps Showing Up
Korea isn't new here. The LG CNS partnership pointed the same way, and Hanwha adds a securities firm to that run. But the price hasn't been paid for any of it yet.
$LINK Market Data Snapshot
CoinMarketCap data at 09:10 UTC on October 30, 2026 shows LINK at $11.02, down 2.98%, with an $8.24B market cap and a 24-hour range of $10.31 to $11.97.
Volume jumped 182.4% to $882.34M, nearly triple the $312.52M a day earlier.
And Bitcoin slipped 2.54% to $77,804.84, with Fear and Greed at 37.
LINK Technical Analysis on the 4-Hour Chart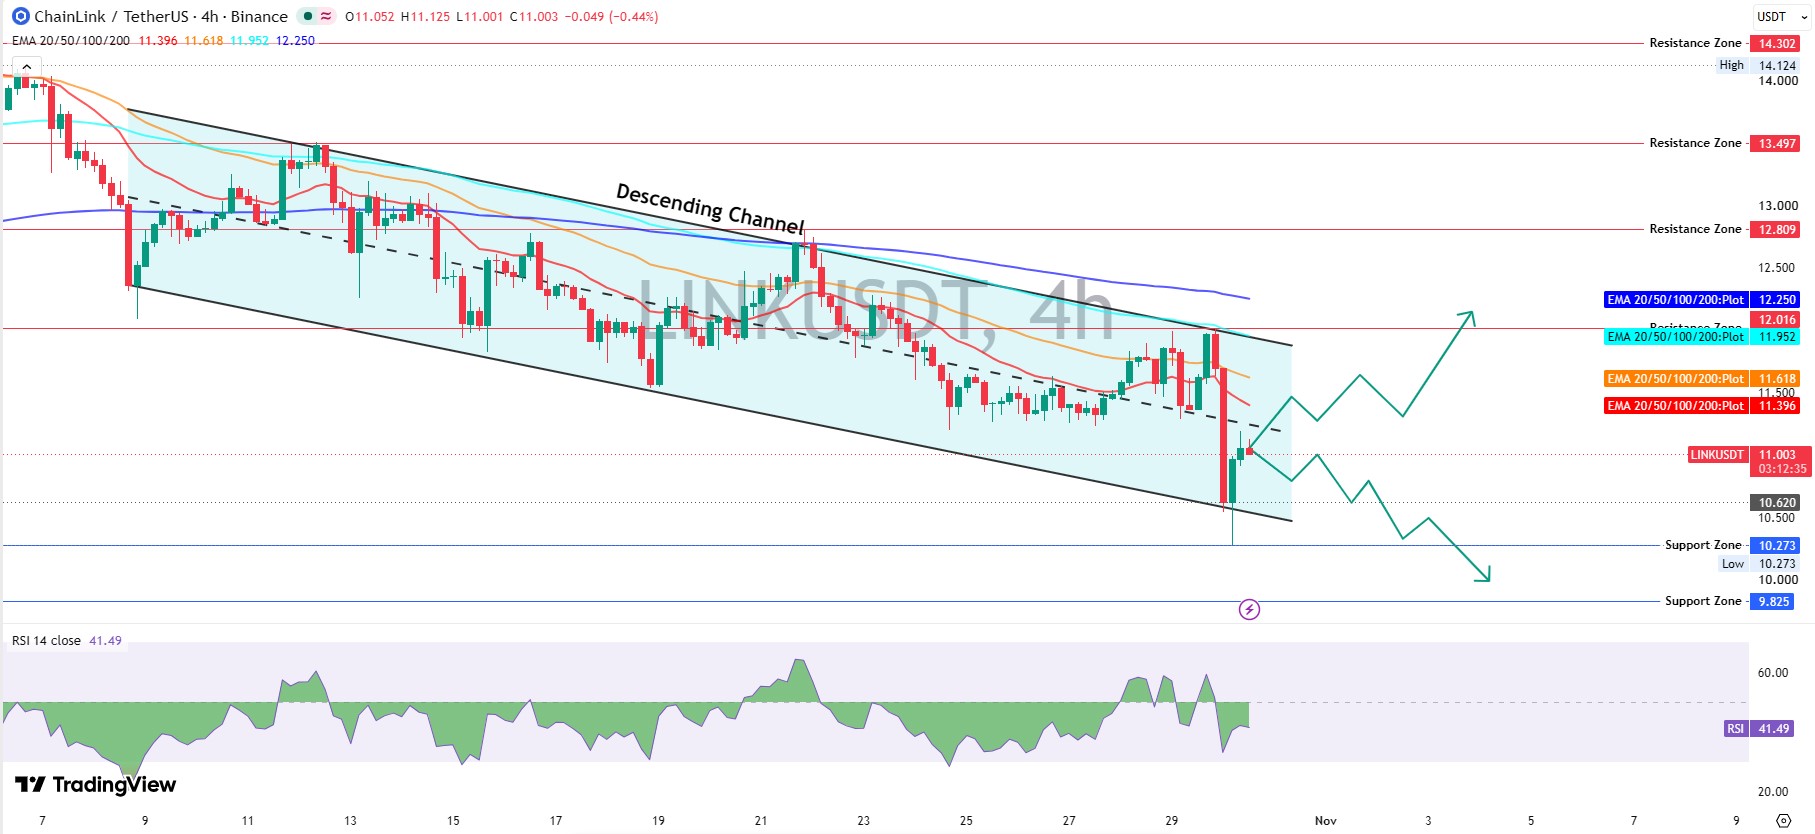
TradingView's 4-hour LINK/USDT chart on Binance shows a descending channel that has capped every bounce for weeks.
Sellers pushed the price under the channel floor, and what happened next? A wick to $10.273, then a snap back inside. $LINK technical analysis now shows $11.003, just under the dashed midline.
EMAs, moving averages that weigh recent trades more, stack bearish. The 20 EMA reads $11.396, the 50 EMA $11.618, the 100 EMA $11.952, and the 200 EMA $12.250. Each sits lower than a day earlier.
RSI Momentum Check
RSI, a 0-to-100 momentum gauge, reads 41.49. Below 50 favors sellers, yet it's far from the oversold zone seen in the RSI breakdown call. A day earlier it read 43.86.
Room for another leg lower remains.
$LINK Support and Resistance Levels
$LINK support and resistance start at $10.620, then the $10.273 wick low and $9.825 below it. Overhead, $12.016 caps the channel roof, followed by $12.809, $13.497, and $14.302.
Anything above $12.016 puts the $12.47 channel breakout idea back in play.
Long Liquidations Tell the Real Story
CoinGlass liquidation data shows $7.02M wiped in 24 hours. Longs took $6.74M of it, about 96%, while shorts lost only $280.30K.
Nearly all of it hit within 12 hours ($6.77M). The latest hour saw just $10.13K, so the flush has cooled.
But crowded longs remain. Binance accounts run 1.7375 longs per short, and OKX shows 2.49.
Whale Wallets and Exchange Holdings
Etherscan counts 913,210 holders. Only 3,918 whale wallets, 0.43% of holders, control 90.43% of market cap, per Etherscan holder data.
Binance Cold Wallet 28 holds 34.69M LINK, and Cold Wallet 20 adds 23.84M.
Spot ETF Flows Stay Flat
SoSoValue ETF data shows $0 net inflow on October 29, 2026, the 9th flat trading day since a $397.26K outflow on October 16, 2026.
Net assets total $206.99M, or 2.45% of LINK market cap. ETF demand would help. There's none. Zero, actually.
Chainlink Price Prediction Scenarios
This Chainlink price prediction covers the next 24 to 72 hours from October 30, 2026, 09:10 UTC. The lean is bearish below $11.396, and dip buyers from the reserve buy bounce must defend $10.620.
Scenario | Trigger | Target | Invalidation | Liquidity Condition |
Bull | 4-hour trade above $12.016 | $12.809 | Trade back under $11.396 | Binance withdrawals resume, ETF inflows return |
Base | Range of $10.620 to $11.396 | Same range | Volume break of either edge | Volume cools from $882.34M |
Bear | 4-hour trade under $10.620 | $10.273, then $9.825 | Trade back above $11.396 | More long liquidations, exchange fear lingers |
Chainlink Price Forecast for the Next Week
The Chainlink price forecast is a $10.620 to $11.396 range until volume picks a side. A 4-hour trade under $10.620 points to $10.273, a 6.8% drop from $11.02.
Beyond that, direction hangs on whether the 200 EMA at $12.250 flips to support, and the November price outlook covers the wider range.
Can $LINK Reach $12 This Week?
Can LINK reach $12 from here? It needs an 8.9% climb through the 100 EMA at $11.952 and the $12.016 roof. So who buys there if spot volume fades?
Call the chart bearish. Then again, a wick that deep, rejected that fast, doesn't look like capitulation.
Risks to the Chainlink Price Prediction
Binance's promised post-mortem is the biggest unknown for this Chainlink price prediction. If the loss estimate grows or withdrawals stay paused, exchange fear could spread across altcoins.
And Bitcoin at $77,804.84 keeps the market dip analysis relevant for every altcoin chart.
Disclaimer: This article is for information only and isn't financial advice. Crypto prices swing fast, and scenarios aren't guarantees. Research independently before any trade.
0
0

 Manage all your crypto, NFT and DeFi from one place
Securely connect the portfolio you’re using to start.


