
Chainlink Price Prediction: Is LINK Adoption Already Priced In?

0
0

Can 8 fresh integrations rescue a token that's still down 33.50% over a year?
This Chainlink price prediction starts at $11.36, the CoinMarketCap reading at 05:45 UTC on November 2, 2026, with every major moving average sitting overhead. Chainlink adoption keeps stacking up, much like the Polymarket oracle feeds that landed earlier, yet LINK price today barely reacts.
Chainlink Price Prediction Data Snapshot
LINK trades at $11.36, down 2.2% in 24 hours, per CoinMarketCap data at 05:45 UTC on November 2, 2026. Chainlink ranks 14th with an $8.5B market cap.
The 24-hour range runs from $11.24 to $11.83.
Volume slid 7.66% to $269.96M, well below the $458.3M logged two days earlier.
Chainlink News Today: 8 Integrations Hit the Feed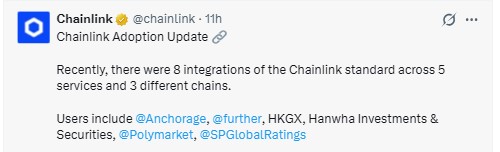
Breaking. Chainlink news today is an adoption update.
8 integrations of the Chainlink standard landed across 5 services and 3 chains.
Named users include Anchorage, Further, HKGX, Hanwha Investments and Securities, Polymarket, and S&P Global Ratings, per the official Chainlink post.
A securities house and a ratings agency now share the same oracle standard. An oracle is the feed that brings real-world data on chain.
The market's answer came fast. A 2.2% dip.
Chainlink Technical Analysis: How the Week Played Out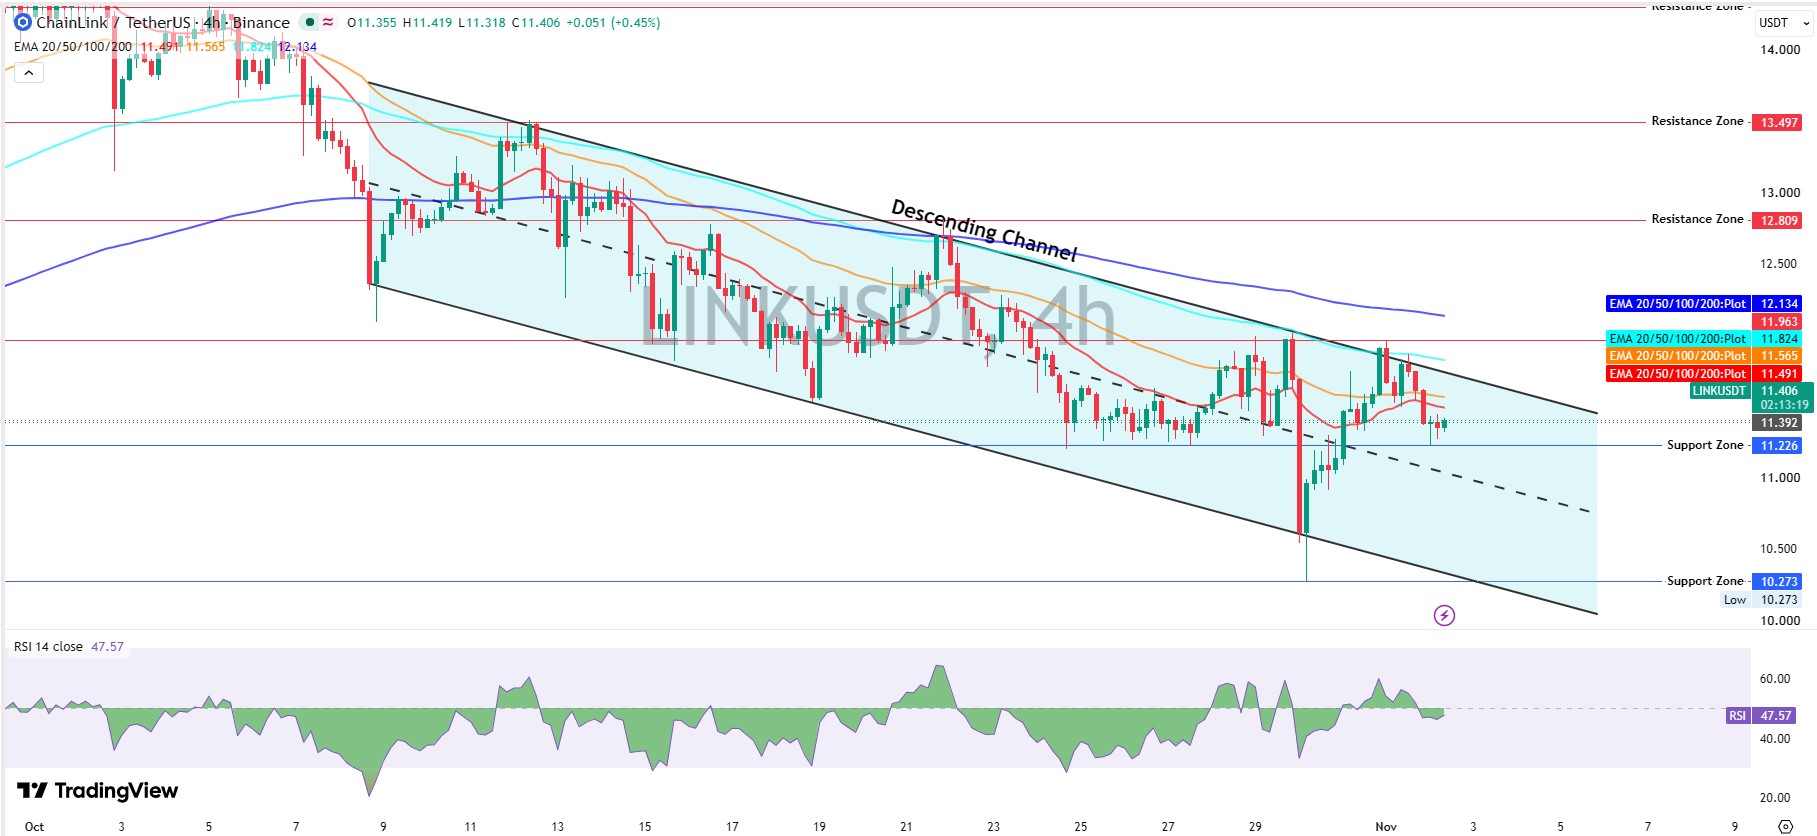
A Spike, a Bounce, a Rejection
Chainlink technical analysis: the TradingView 4-hour chart tells it in order.
LINK spent roughly 3 weeks inside a descending channel, two downward-sloping lines that box price in.
Sellers shoved the price to a $10.273 wick low near the channel floor. Buyers erased most of it within hours.
And then the climb. It ran out of room at the $11.963 line, and the price slid back to $11.406 on Binance.
RSI and Moving Averages Stack Overhead
RSI reads 47.57. Call it a base. No, scratch that. A base needs rising lows on rising volume, and volume fell 7.66%.
An EMA, or exponential moving average, weights recent trades more. LINK now trades under every EMA on the chart.
The 20 EMA reads $11.491, the 50 EMA $11.565, the 100 EMA $11.824, and the 200 EMA $12.134.
That's 0.75% to 6.38% above spot. A previous channel breakout attempt faded below $12.50 before sellers regained the roof.
LINK Support and Resistance Map
LINK support and resistance sit in clear order. Support starts at $11.226, 1.58% below spot, then $10.273, 9.93% lower.
Overhead, the next walls are $12.809, 12.30% higher, and $13.497, 18.33% higher.
Does Chainlink Adoption Move the LINK Price?
Over 90 days, LINK is up 39.29%, and 180 days reads +16.59%, per CoinGlass.
But 30 days sits at -17.48%, and the 1-year change is -33.50%. The Hanwha partnership news landed inside that slide.
Adoption is the slow engine. Fund flows are the fast one, and today they point down.
Chainlink ETF Flows Stay Red
Chainlink ETF flows printed -$1.77M in the latest SoSoValue ETF data, all from Grayscale's GLNK.
Net assets sit at $195.20M, 2.27% of LINK's market cap. But daily value traded was only $11.38M.
Funds are leaving and volume is shrinking. So who's left to push price through $11.565?
Futures Positioning Hurts Longs
Longs paid this time. CoinGlass LINK data shows $643.78K liquidated in 24 hours, with $629.91K of it long.
Liquidations are forced exits when leveraged bets run out of margin. And crowded longs feed more of them if $11.226 breaks.
Binance accounts lean longer than before, with the long/short ratio at 1.9994 against 1.7012 in the previous read.
Holder Data Shows Where the Weight Sits
Etherscan holder data counts 914,516 holders, and the top 100 wallets control 60.81% of supply. Whales, meaning very large balances, number 4,007 and hold 90.49% of market cap.
Whales and Selling Pressure
But big isn't the same as bearish. Chainlink's own Community Staking Pool holds 4.0876%, and several noncirculating supply wallets hold 2.8750% to 3% each.
Binance Cold Wallet 28 holds 3.4694%, the exchange balance worth tracking. The earlier whale holder analysis tracked this group.
Chainlink Price Prediction Scenarios
Fresh names like HKGX, covered in the HKGX gold channel test, add fuel only after buyers reclaim the moving averages. This Chainlink price prediction table covers the next 7 to 30 days.
Scenario | Trigger | Target | Invalidation | Liquidity Condition |
Bullish | 4-hour trade above $11.565, then $11.824 | $11.963, then $12.134 | Trade under $11.226 | Volume expands from $269.96M, ETF flows turn green |
Base | Chop between $11.226 and $11.565 | Range holds | Either edge breaks on volume | Volume near $269.96M, flat ETF flows |
Bearish | 4-hour trade under $11.226 | $10.273 | Reclaim of $11.565 | Long liquidations climb, fund outflows continue |
LINK Price Target by Timeframe
Next 7 Days
The nearest LINK price target is $11.565, 1.39% overhead. A 4-hour trade above it points to $11.824, while a break under $11.226 opens $10.273.
Next 30 Days
Buyers need a trade above $12.134, 6.38% higher, to flip the channel. Until then, this setup stays bearish. The year-to-date change of -6.58% implies the year opened near $12.20.
Risks That Change the Chainlink Price Prediction
Bitcoin-led selling comes first. Altcoins tend to follow on risk-off days, as the market dip outlook covered.
A 4-hour trade under $11.226 exposes $10.273 fast, since long liquidations already hit $629.91K.
The bearish Chainlink price prediction flips only on a 4-hour trade above $12.134 with volume behind it.
Disclaimer: This article is for educational market analysis only and isn't financial advice. Crypto assets are highly volatile, scenarios aren't guarantees, and readers should research independently before trading.
0
0

 Manage all your crypto, NFT and DeFi from one place
Securely connect the portfolio you’re using to start.


