
XRP Price Crashes Below $1.30: What Caused It and What Comes Next

0
0
$XRP has slipped under the $1.30 mark that bulls defended for most of October, and the daily chart now looks tired. The token is down roughly 15% over the past month, trades beneath every major moving average, and the strongest arguments bulls had in September have gone quiet. Let’s walk through where XRP price stands, what pushed it here, and where the next targets sit on both sides.
Why Is XRP Price Below $1.30 Today?
XRP opened October near $1.50, lost that level around October 7, bounced off $1.33 twice mid-month, and has been grinding lower since. On October 27 the daily candle opened at $1.307, printed a low of $1.289, and currently trades around $1.294, down about 0.9% on the day.
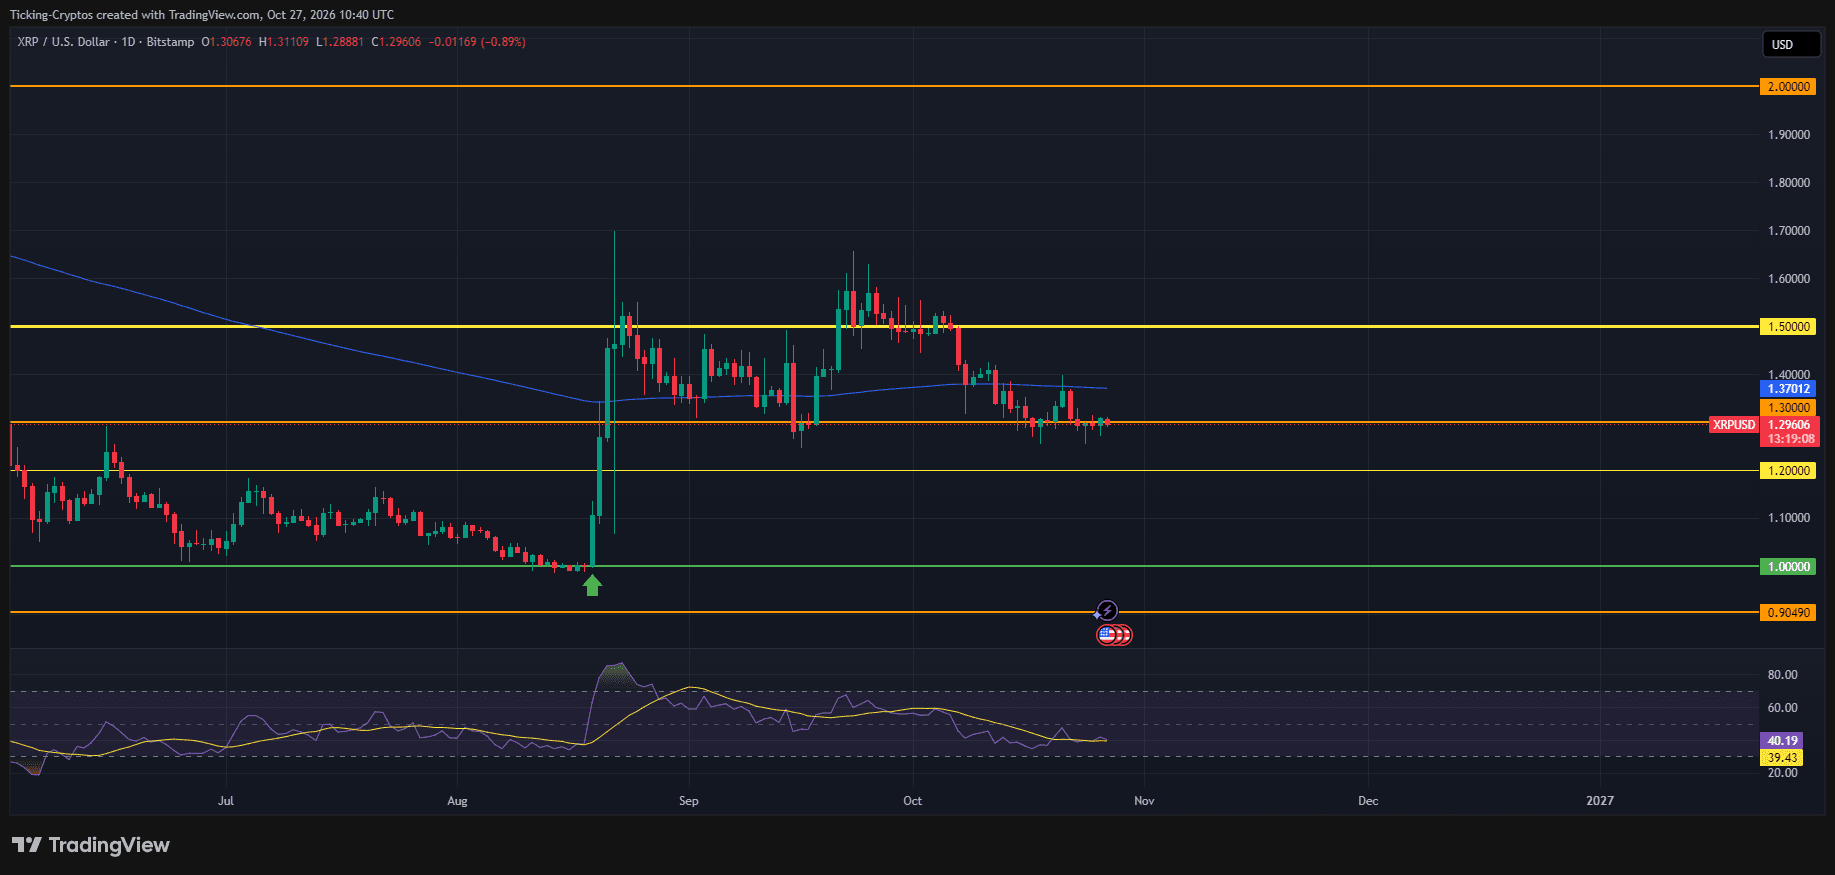
On the daily chart the picture is cleaner. The $1.30 line that acted as a floor through mid-October has been tested from below for a week now. The blue moving average sits at $1.37 and has flattened out, while the RSI reads just above 40 and keeps drifting lower without reaching oversold territory. That combination usually means a market that is weak but not yet exhausted.
Below $1.30, the chart has very little structure until $1.20, which held XRP in late August. The next major levels after that are $1.00, where the late-August breakout started, and $0.90, the last horizontal before the summer lows. You can follow the live XRP price on our crypto prices page.
What Caused the XRP Price Crash?
No single headline sank XRP. Four things lined up at once.
Broad Market Weakness and Long Liquidations
The first driver is simply the market. XRP has been trading below $1.30 amid persistent drawdowns across the broader cryptocurrency market, and the leverage flush made it worse. After a failed breakout near $1.39, XRP fell toward $1.30 with more than $300 million in long positions liquidated. Every time leveraged longs pile in at support, a small dip turns into forced selling, and that is exactly what happened in the second half of October.
The XRP Ledger Bug Fix Delay
The second driver is network news that rattled confidence. In early October, the XRP Ledger disclosed two software vulnerabilities, including a critical bug that could have allowed attackers to create new, spendable XRP. The payment engine flaw was patched quickly, but a follow-up amendment ran into governance trouble. The activation of fixCleanup3_4_0 was pushed back from October 23 to November 4 after validator support briefly fell below the required threshold, resetting the mandatory 14-day approval countdown. Support has since climbed to 31 of 35 validators, so the fix is on track, but the episode reminded traders that XRPL governance can stall, and the on-ledger lending system still lacks enough validator support to begin its own countdown.
Whales Trimming and Coins Moving to Exchanges
The third driver is on-chain. The number of wallets holding 10 million to 100 million XRP fell from 351 to 339, while exchange-linked balances rose by roughly 47 million XRP, about $61 million at current prices. Coins moving onto exchanges are usually coins being positioned for sale. There is a counterpoint: Santiment reports that wallets holding at least 10 million tokens now control about 68.5% of supply, the highest concentration since November 2022. So the biggest whales are still accumulating, while mid-sized holders are taking chips off the table.
Institutional Demand Slowing, Not Vanishing
The fourth driver is the ETF story cooling off. The long-term trajectory remains constructive, supported by cumulative ETF inflows of $1.8 billion and net assets totaling $1.5 billion, according to SoSoValue, but the pace of fresh inflows has slowed. The same goes for corporate buying: Ripple-backed treasury firm Evernorth Holdings has filed with the SEC to raise $81 million to purchase additional XRP. That is supportive, but $81 million does not move a token with a market cap in the tens of billions. Even Ripple’s announcement of final U.S. approval, which CEO Brad Garlinghouse said gives the company a federally supervised platform to support RLUSD and provide custody, has not produced a sustained price recovery.
XRP Price Prediction: Where Is the Next Low?
As long as XRP closes daily candles below $1.30, the bias stays down. The chart gives three downside targets:
- $1.26 is the first stop. This is the lower edge of the channel analysts have been tracking since mid-October and the level where the October 19 wick found buyers. A quick bounce here would be normal, but it is not strong support.
- $1.20 is the real test. This horizontal held the late-August pullback and is the last meaningful structure before the summer range. If $1.20 breaks on a daily close, the move from $1.00 to $1.70 in August is fully retraced.
- $1.00 is the bear case. The August breakout started here, and the level has been defended repeatedly. Beneath it, $0.90 is the next horizontal and the one no bull wants to see.
The RSI near 40 argues against an immediate collapse. XRP tends to find footing when the daily RSI dips into the low 30s, which would roughly line up with a $1.20 test. Santiment has also pointed out that this kind of fear and skepticism has historically acted as a contrarian signal for XRP’s price, and previous dips into heavy negative sentiment were followed by stabilization.
XRP Price Prediction: How High Can XRP Rebound?
The bull case needs one thing first: a daily close back above $1.30. Until then, every bounce is a relief rally. If buyers reclaim it, the upside map looks like this:
- $1.37 is the first hurdle, where the flattening moving average and the EMA cluster sit. XRP holds below the 50-day, 100-day and 200-day EMAs clustered between roughly $1.33 and $1.37, so clearing this zone would flip the near-term trend.
- $1.45 to $1.50 is the next target. The SuperTrend level at $1.45 and the downward resistance trend line from $1.72 outline higher hurdles, and $1.50 capped the entire early-October range.
- $1.70 is the September high and the measured move of the August breakout. A return here would confirm the bull structure is intact.
- $2.00 is the long-term target, and it needs a catalyst: a clean November 4 activation of the ledger fix, the XRPL lending system going live, or ETF inflows picking back up.
Is the XRP Price Crash a Buying Opportunity?
XRP at $1.29 is not a screaming buy, but it is not a broken chart either. The structural story is still constructive: the largest whales are at their highest concentration in four years, ETF assets sit at $1.5 billion, and the critical bug was patched with no sign of exploitation. The problem is timing. With price under every moving average and no hard support until $1.20, the risk-reward favors waiting for either a reclaim of $1.30 or a deeper flush toward $1.20 before stepping in.
For traders, the key dates are November 4, when the ledger fix is due to activate, and whichever daily close first settles the $1.30 question. Until then, XRP is a range to respect, not a trend to chase.
0
0

 Manage all your crypto, NFT and DeFi from one place
Securely connect the portfolio you’re using to start.


