
Price Prediction 11/9: BTC, ETH, BNB, XRP, SOL, ZEC

0
0

ZEC has been on the decline over the last two days, shedding more than 8%. However, the bears have since reduced selling pressure, while buying activity is improving.
The same trend is evident across the broader market. Total cryptocurrency market capitalization is currently stable at around $2.50 trillion, and Monday’s candle is green. Nonetheless, several major assets experienced notable sell-offs a few hours ago.
Amid the sharp decline and gradual recovery, some altcoins are recording significant price gains. For example, AVAX is up almost 13% in the last 16 hours. It has broken above its four-day high and is approaching its 14-day high.
Arbitrum is also experiencing a notable spike, gaining 9% over the same period. Although several other assets are seeing increased buying pressure, most cryptocurrencies have yet to fully recover the losses incurred last week.
The last seven days were marked by substantial selling pressure, particularly on Thursday and Sunday. Exchange-traded funds were also affected by the bearish sentiment, recording negative netflows. Nonetheless, there were periods of notable recovery, supported by positive fundamentals.
Looking ahead, several key fundamental events are expected over the next four days. One of them is the CPI report scheduled for Tuesday, with consensus estimates pointing to a slight increase. Investors are watching this metric closely, although its potential impact on prices remains uncertain.
Let’s see what the charts suggest about the coming days.
BTC/USD
Bitcoin ended the previous week with losses exceeding 4%. Wednesday was particularly noteworthy, as prices surged by almost 4%, testing $80K for the first time in six days. However, the uptick was short-lived, with the asset wiping out all its previous gains the following day.
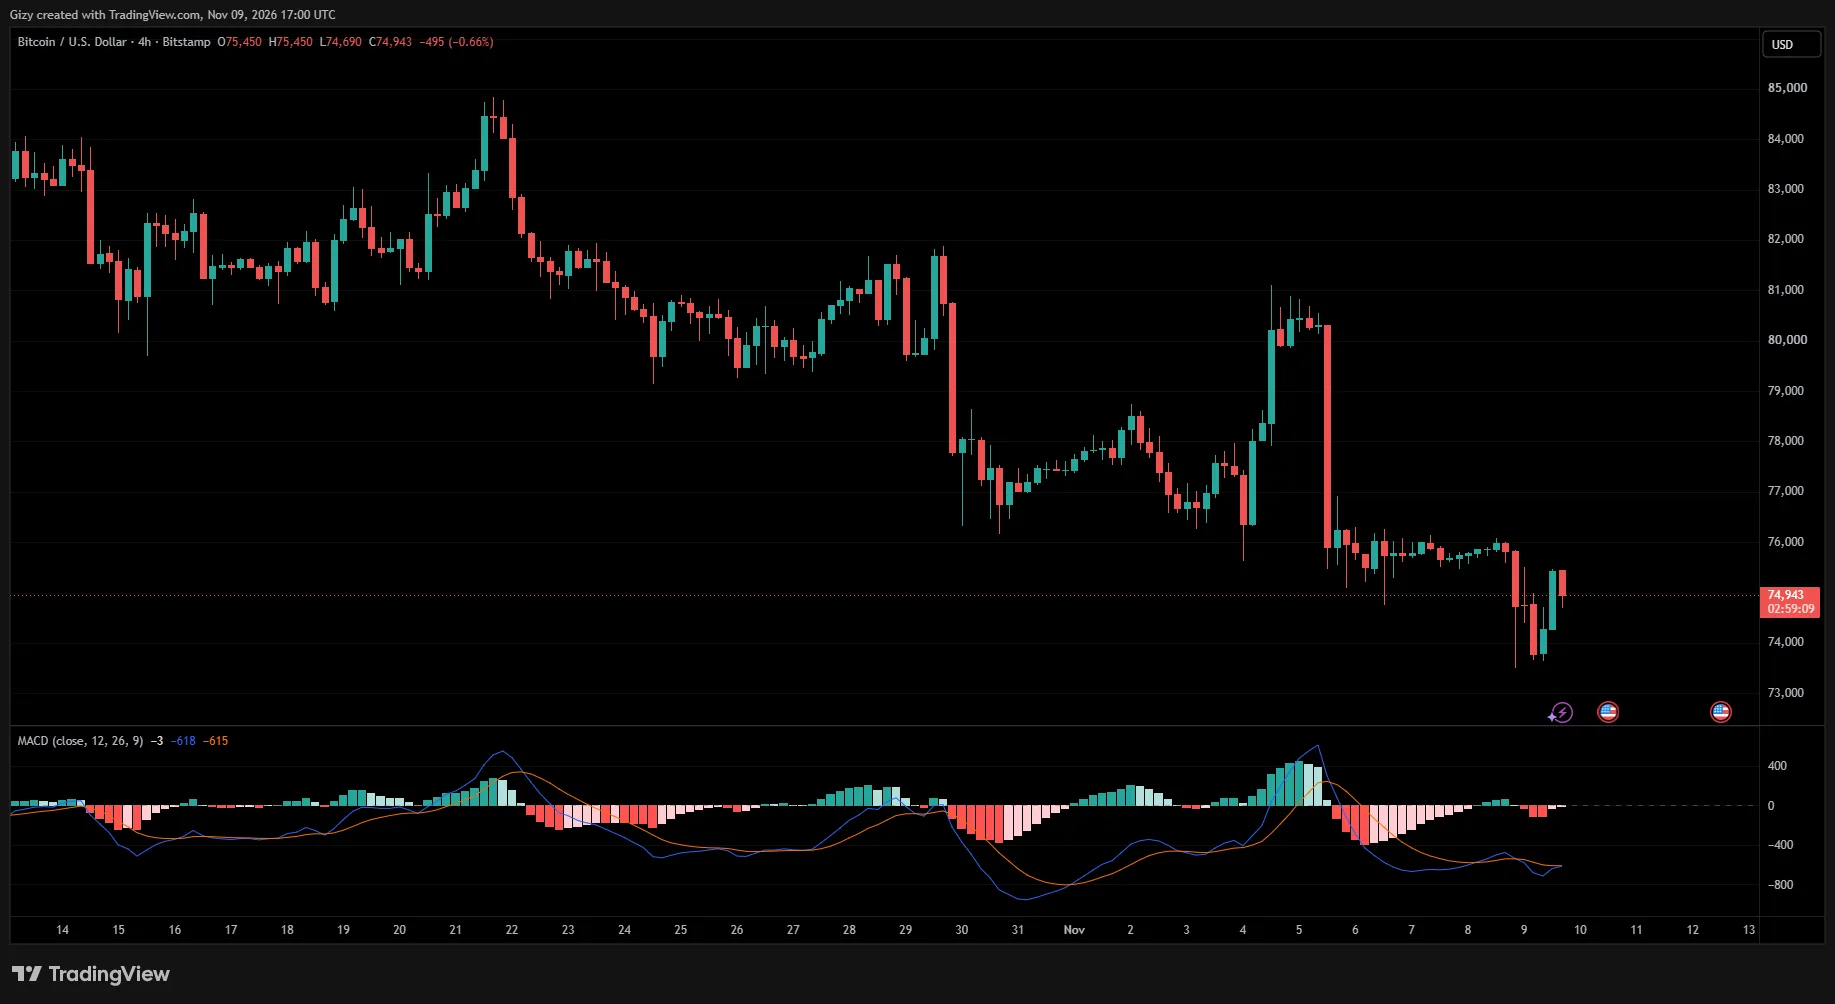
A look at the 4-hour chart shows that there were periods of little or no volatility. Although the asset is becoming more volatile, it continues to print a Doji on the 1-day chart.
Away from price action, smaller timeframes show signs that the apex coin may be gearing up for a notable uptrend. One indicator supporting this possibility is the Moving Average Convergence Divergence (MACD), which has just recorded a bullish crossover.
This development suggests an increased likelihood of further upside in the coming hours. If prices follow this signal, Bitcoin may attempt to reclaim $78K within the next two days. Previous price movements point to a decisive move above $76K as confirmation of such a recovery.
ETH/USD
The 1-day chart shows that Ethereum was mostly range-bound last week, failing to record a significant price change on four of the seven days. However, it ended the week with losses exceeding 6%. Like ZEC, Sunday was marked by a massive sell-off, resulting in an almost 5% decline.
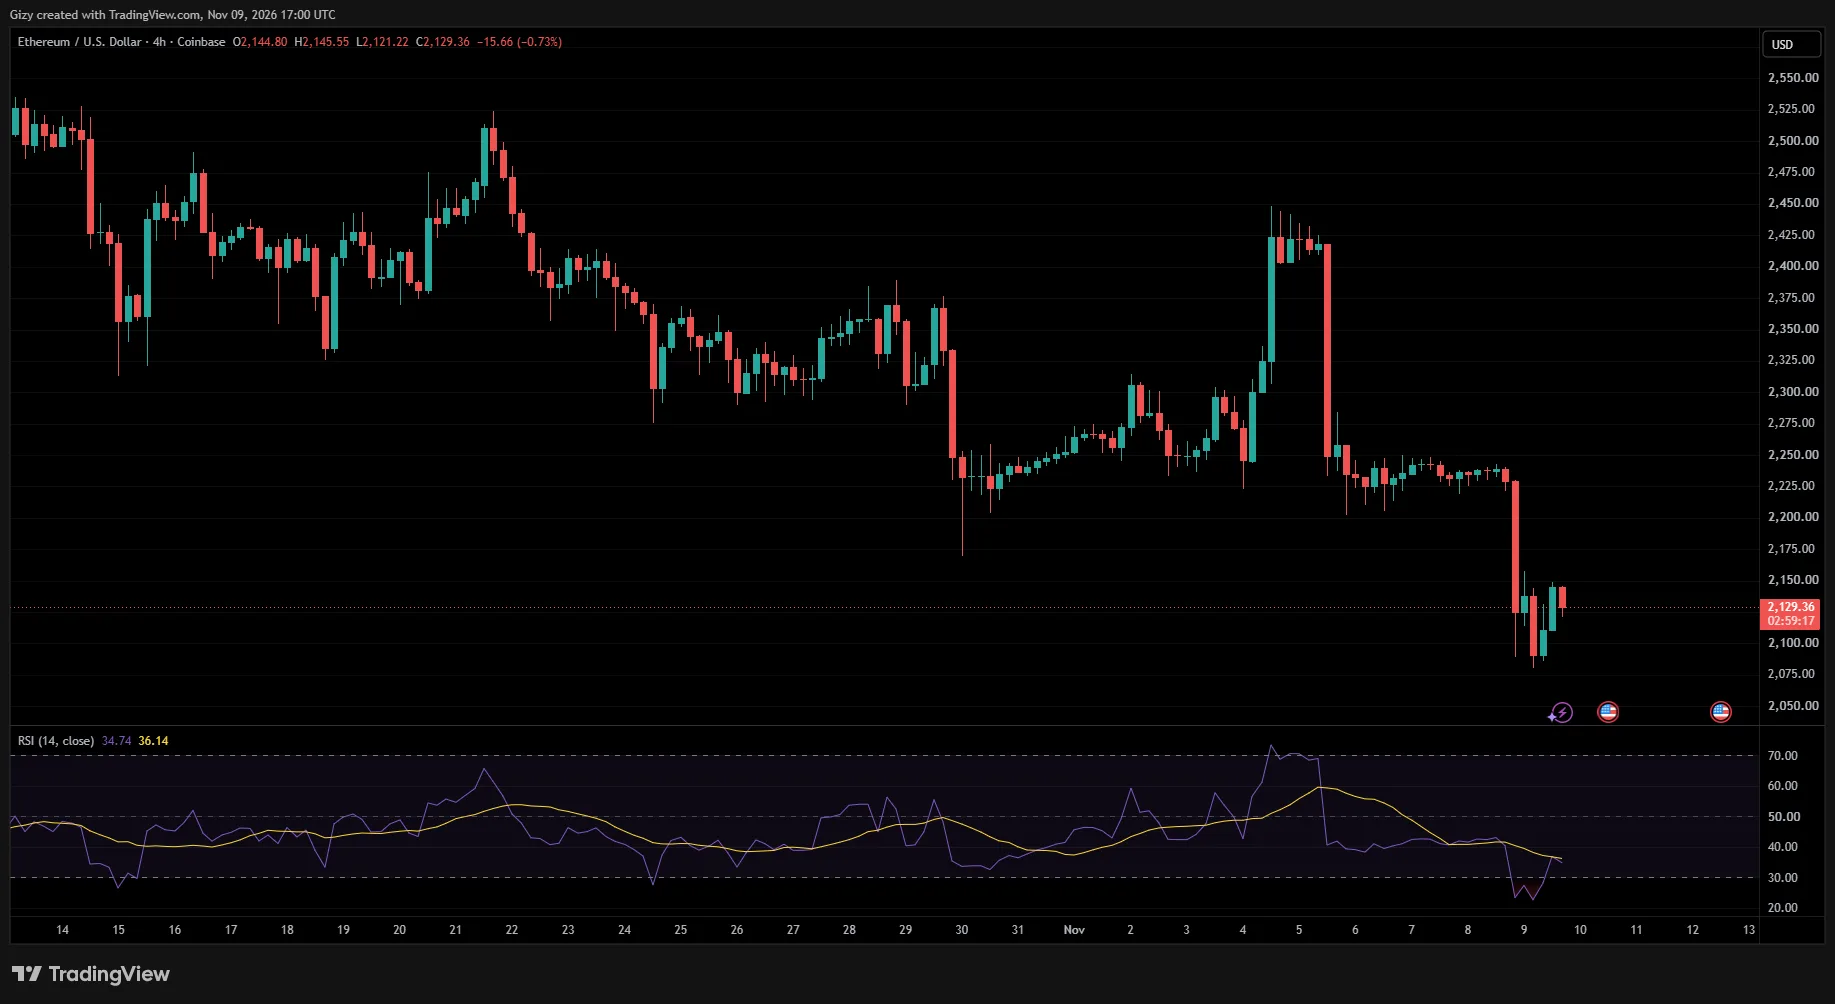
Although the bearish trend continued into the early hours of Monday, the bulls have since staged a recovery, which is more visible on the 4-hour chart. Ethereum maintained its upward momentum for more than eight hours, closing its last two sessions with green candles.
Following the rebound at $2,080, the Relative Strength Index (RSI), which had previously dropped below 30, exited the oversold territory. The indicator remains close to that boundary, suggesting there may still be room for further upside.
However, the current candle is red, suggesting that the altcoin is losing momentum. It has also faced rejection at an emerging sell zone. If it fails to break above $2,150, it may attempt to retest $2K. Conversely, a resumption of the uptrend could send it above $2,240.
BNB/USD
BNB is trading slightly above a short-term barrier. It bounced off this level several times over the last seven days before eventually slipping below it.
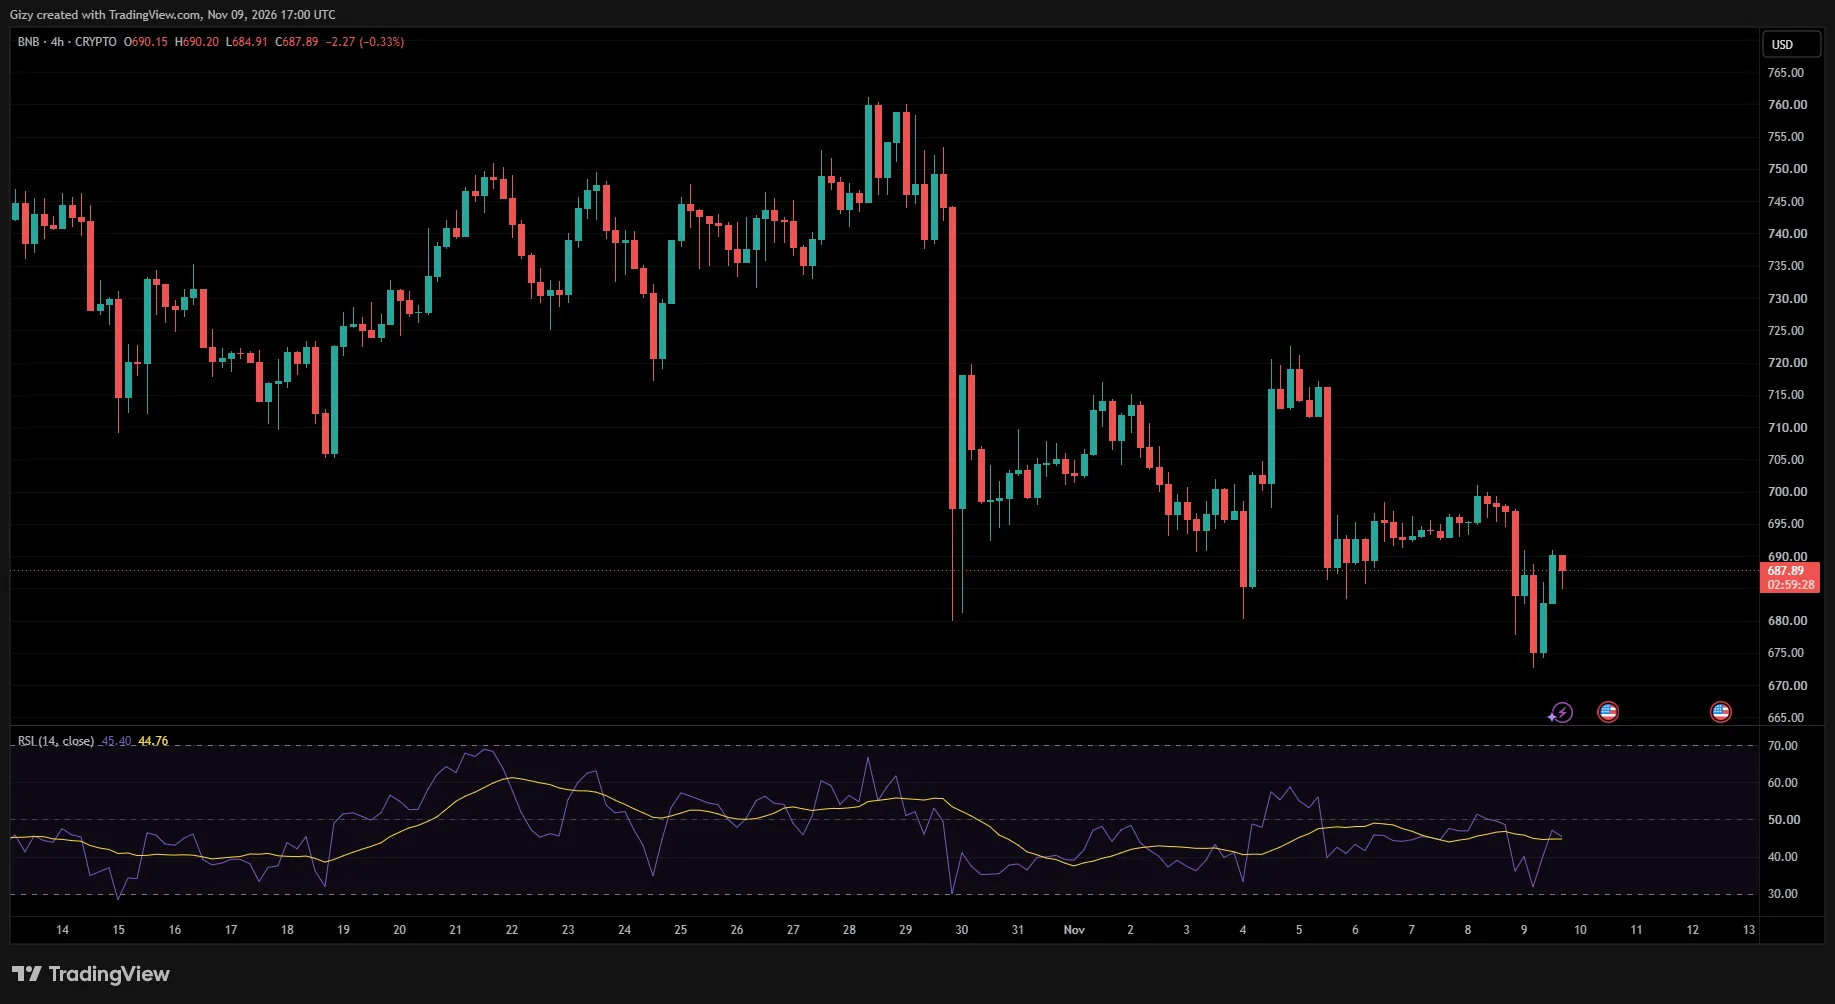
Although trading above $685 at the time of writing, the asset is threatening to fall below the level again. Such a decline could trigger a steeper drop, potentially sending BNB as low as $660.
On the other hand, the Relative Strength Index (RSI) has moved close to 30. The 4-hour chart shows several instances in which further upside followed similar readings. If the pattern repeats, BNB may attempt to reach $720.
XRP/USD
XRP reclaimed $1.10 during the previous 4-hour session. However, it is struggling to hold above the level as selling pressure continues to mount. It retraced to a low of $1.08 in the early hours of Monday before bouncing. However, the current price action suggests that the recovery may only be temporary.
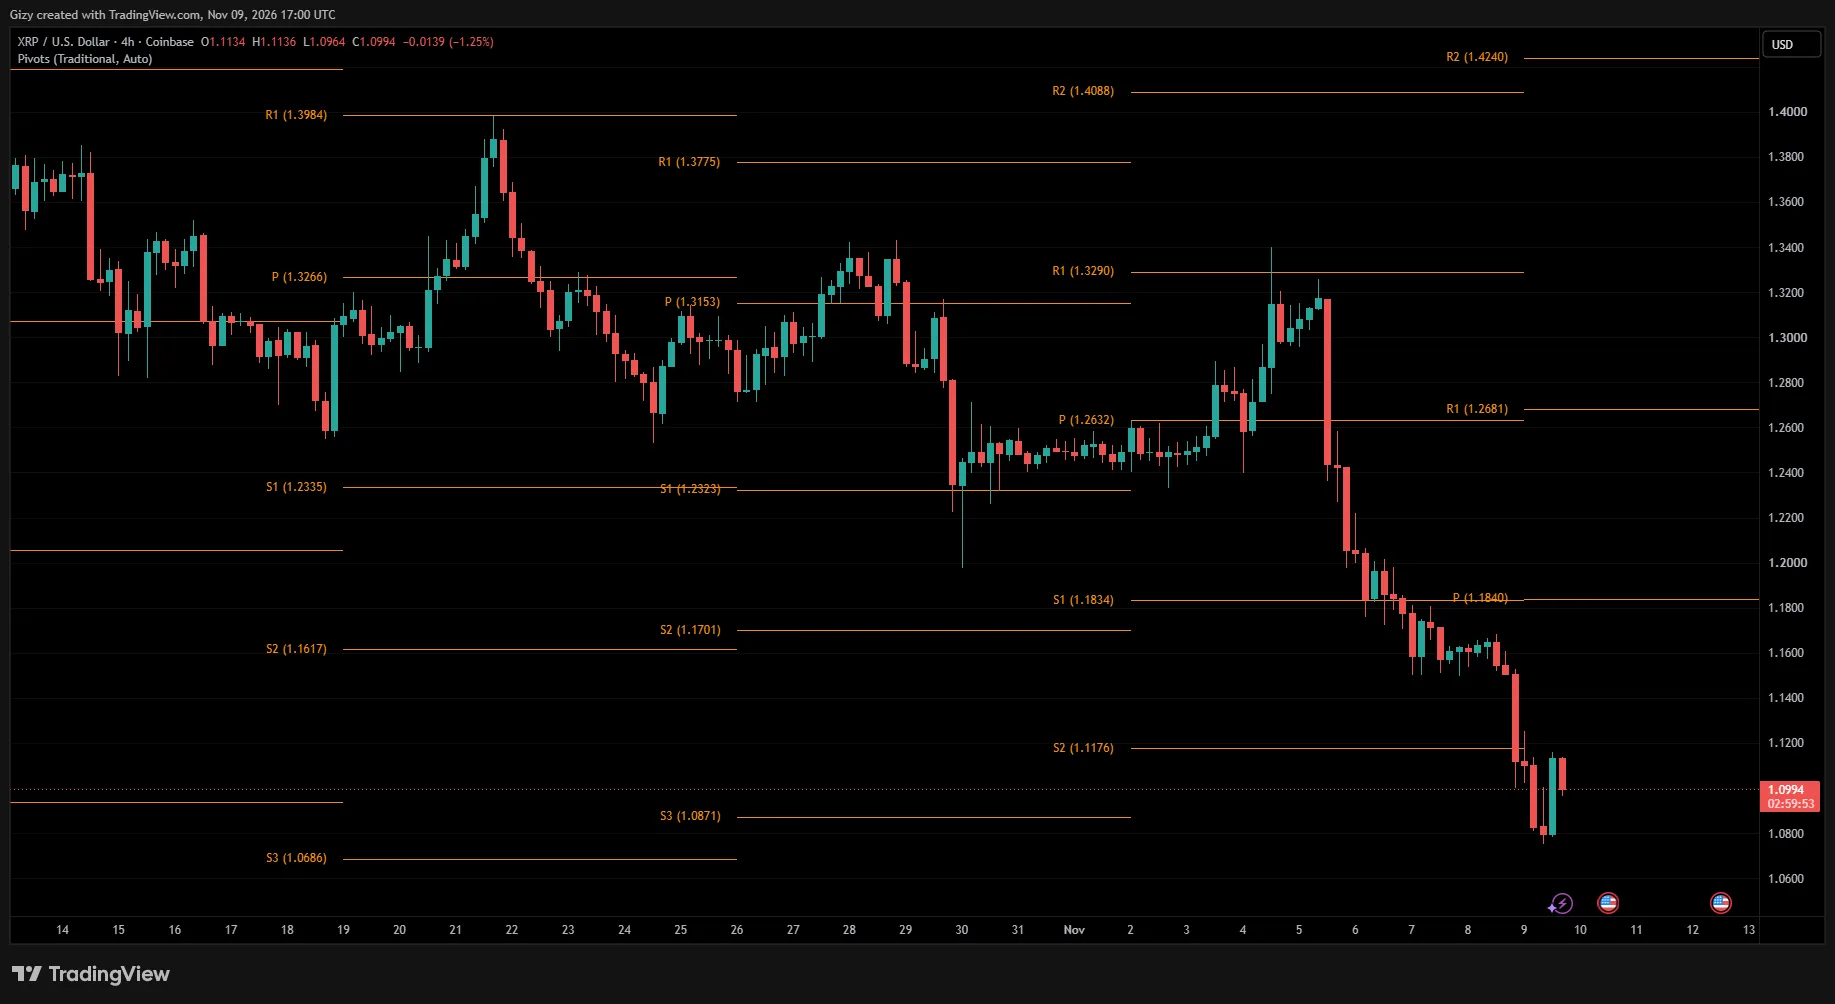
The Pivot Point Standard indicator highlights the importance of the $1.08 level. Losing this support could send XRP lower to retest $1. Previous price movements suggest that there is no strong demand concentration around this level, increasing the likelihood of a break below it.
It remains to be seen whether the bulls can revive upward momentum. If they succeed, XRP could retest $1.20 by Wednesday.
SOL/USD
Like ZEC, Solana is struggling to recover the losses it incurred last week. It also retraced a few hours ago and continues to face notable selling pressure, despite a slight recovery in buying activity.
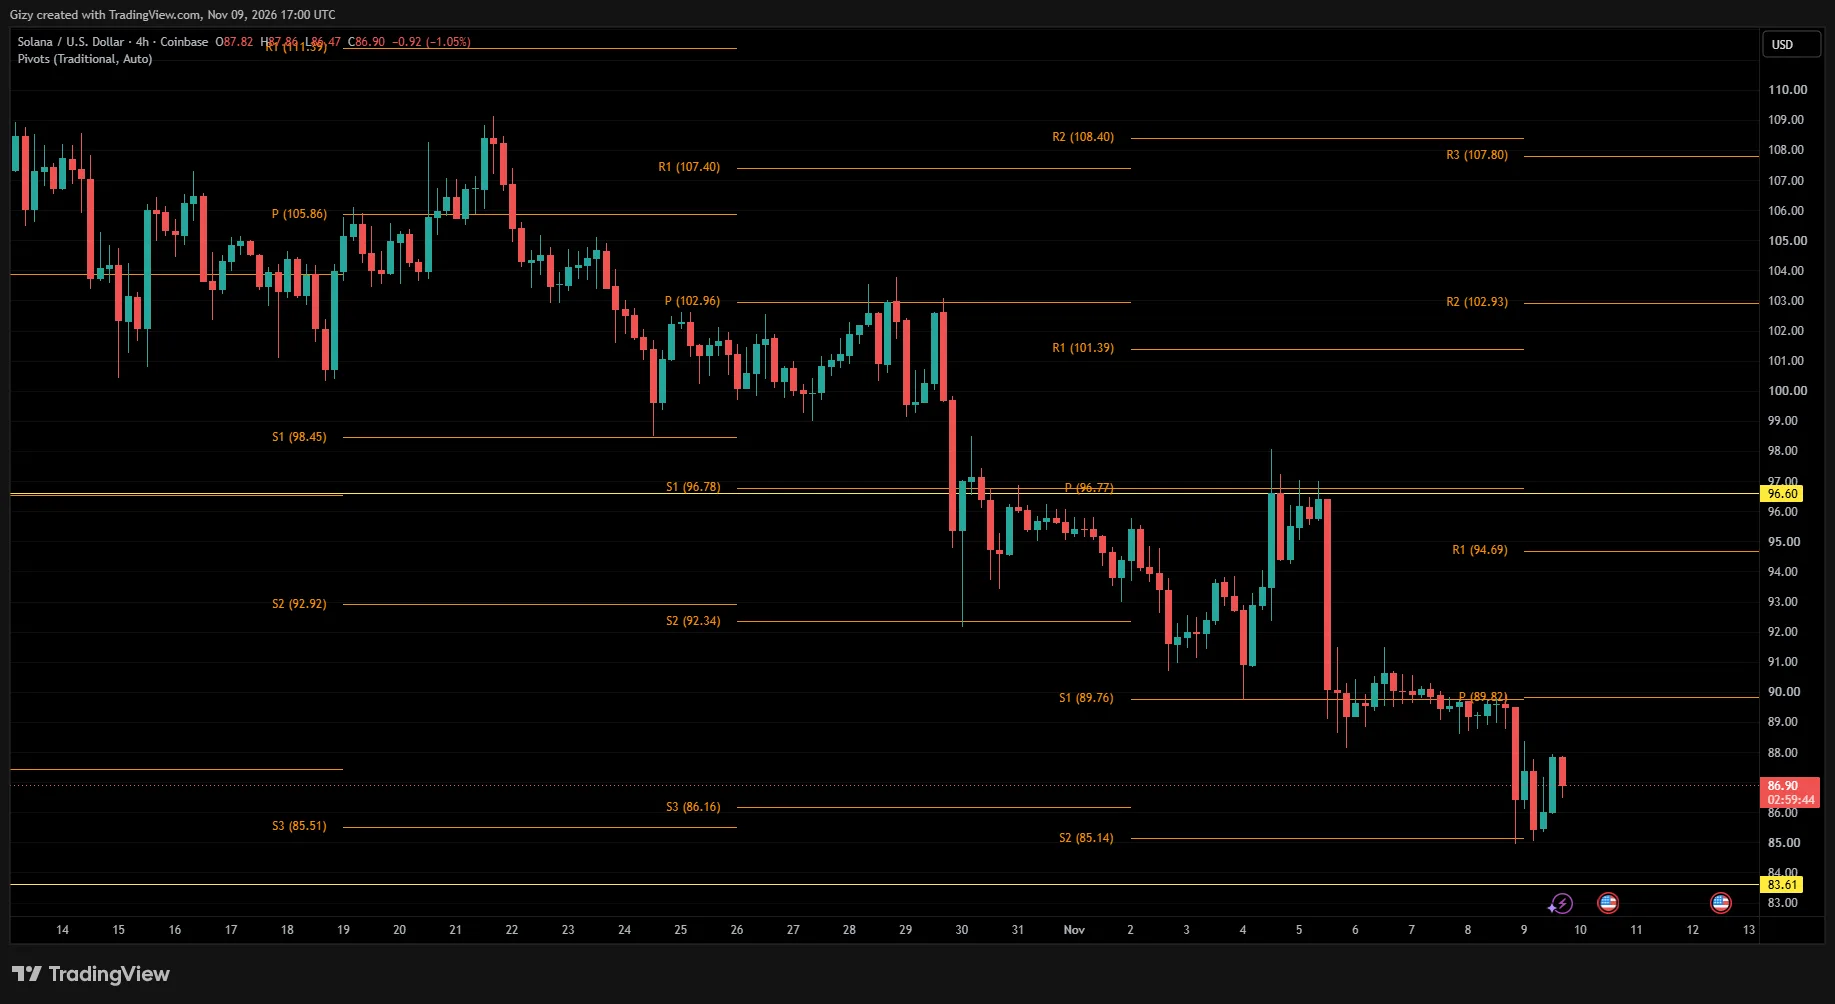
During Sunday’s decline, the altcoin bounced off the previous first pivot support at $85. At the time of writing, it is trading close to the pivot point and may be preparing to retest it. A successful bounce could pave the way for a move to $90 in the coming hours.
However, the current red candle suggests that selling pressure may be returning. If the bulls fail to reignite upward momentum, a drop to $81 may follow.
ZEC/USD
A previous analysis noted that ZEC was at a crossroads and faced the risk of slipping lower. The current downtrend suggests that prices are playing out as anticipated.
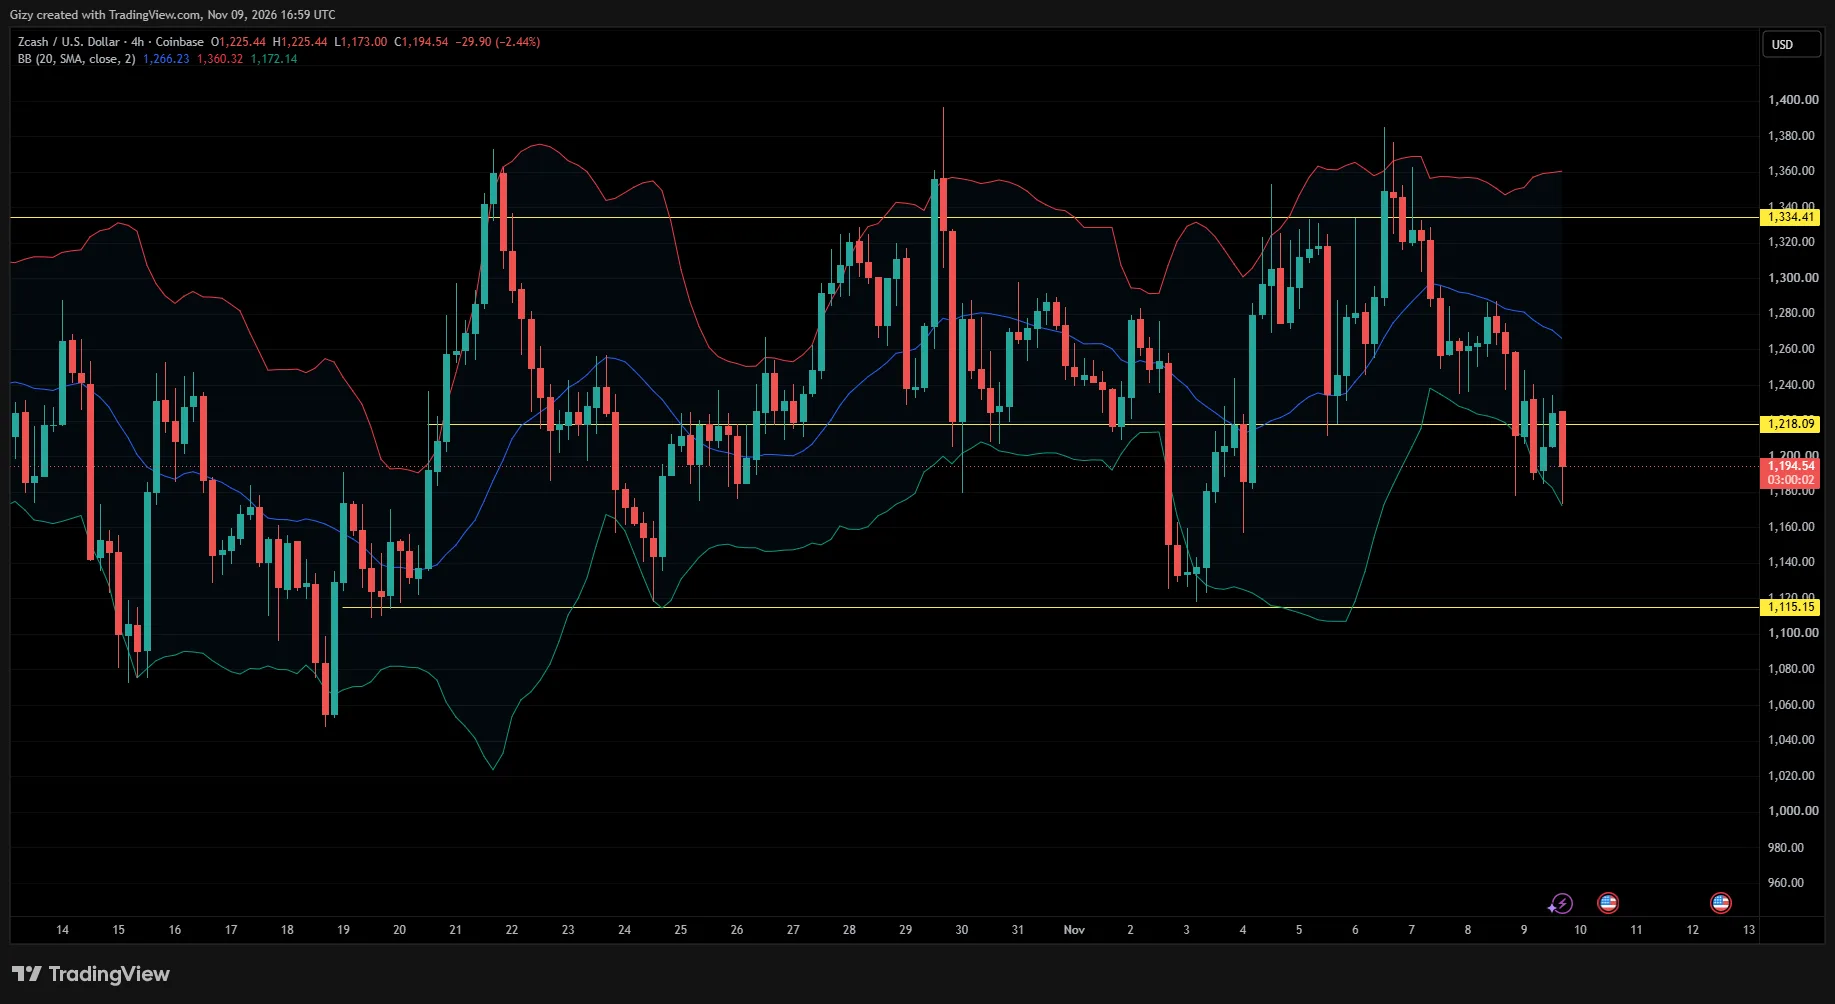
The 4-hour chart shows that the bulls have attempted to halt the decline, but selling pressure remains. Previous price movements point to $1,220 as a key barrier and a potential decider between a surge to $1,350 and a decline to $1,120.
Currently trading at $1,190, the asset remains below this level. However, there is no confirmation that the downtrend will continue, as sellers have yet to secure a decisive move below it. The current candle is therefore important: a red close would increase the likelihood of a drop to $1,120.
The post Price Prediction 11/9: BTC, ETH, BNB, XRP, SOL, ZEC appeared first on CoinTab News.
0
0


 Manage all your crypto, NFT and DeFi from one place
Securely connect the portfolio you’re using to start.
 Where will Bitcoin trade next?
Live Polymarket and Kalshi odds on Bitcoin price targets, compared side by side.
See Bitcoin price odds


