
Ethereum Wiped Off 2-day Gains. Why and What’s Next?

0
0

Ethereum (ETH) is down 3% on Thursday after recording two consecutive days of gains. At its peak, the altcoin had climbed more than 4% between Tuesday and Wednesday.
The latest correction has weakened bullish sentiment, raising questions about whether the previous rebound had enough momentum to sustain a breakout. Before examining why ETH is retracing, it is important to understand what drove the earlier rally.
A previous analysis noted that a surge above $2,500 hinged on a decisive move above the pivot point. ETH eventually crossed that level on Tuesday, reaching a high of $2,525 on Wednesday, hours after the initial breakout.
The move also triggered the liquidation of short positions, reinforcing expectations of further upside. Given the momentum across those two sessions, traders increasingly anticipated a more substantial breakout. However, Thursday’s price action has painted a different picture.
Interestingly, Ethereum was not the only asset to experience this reversal. The broader cryptocurrency market followed a similar pattern, suggesting that the pullback may have been influenced by factors affecting the wider market rather than ETH alone.
To understand the reversal, it is worth examining the developments that may have supported the initial rally.
Geopolitical Developments May Have Helped Ethereum
Between Tuesday and Wednesday, several geopolitical reports circulated, but two stood out as potential catalysts for the market’s recovery.
The first concerned reports that the United States and Iran were nearing an agreement to end their conflict. The prospect of a resolution appeared to ease some concerns about geopolitical risk and its potential impact on global markets.
However, conflicting reports subsequently cast doubt on the prospect of an imminent agreement. Donald Trump also stated that negotiations were not on the table, further weakening expectations of a near-term resolution.
The second development involved reports of a possible peace agreement between Russia and Ukraine. However, subsequent reports indicated that Russia had rejected the proposed terms, raising further doubts about the prospect of a breakthrough.
As these reports circulated, oil prices declined while cryptocurrency prices advanced. The subsequent uncertainty surrounding the negotiations coincided with the reversal in both markets.
Although these developments do not conclusively explain the crypto market’s movements, they may have contributed to the initial improvement in sentiment. As confidence in a near-term resolution weakened, some of the optimism supporting the rally may have faded.
On-Chain Metrics Improved, but the Rally Still Faded
As cryptocurrency prices recovered, several on-chain indicators also improved, potentially reinforcing expectations of a sustained uptrend.
One of these was the Coinbase Premium Index, a metric that tracks the price difference between Bitcoin on Coinbase and other exchanges. It is commonly used to assess relative buying pressure on Coinbase, where institutional and large US-based investors are active.
The indicator had fallen to levels last seen in June during the previous week and remained near those levels on Monday. Beginning Tuesday, however, it recovered as market conditions improved.
Retail demand also appeared to strengthen, as reflected in the Korean Premium Index, which measures the price difference between cryptocurrency markets in South Korea and global markets.
Another encouraging development was the decline in exchange reserves. Over the two-day rally, the amount of ETH held on trading platforms decreased, suggesting that some investors were moving their assets away from exchanges. While this can reduce immediately available selling supply, it does not necessarily mean that all such transfers represent long-term accumulation.
US spot Ethereum ETFs also recorded a positive net flow on Wednesday, ending a streak of outflows that began on October 14. The funds recorded approximately $14 million in net inflows during the session.
These developments suggested that buying interest was returning. Nevertheless, the improvement in spot-market indicators was not enough to sustain ETH’s upward momentum.
The subsequent decline was accompanied by substantial liquidations in the perpetual futures market. Traders lost approximately $220 million across the market over the previous 12 hours, while ETH liquidations accounted for nearly $33 million. Long positions represented approximately 93% of the liquidation total.
The reversal has not only weakened bullish conviction but also increased uncertainty about ETH’s next move. This shift is particularly notable given the change in market sentiment over the past two weeks.
Traders entered October anticipating a massive uptrend. However, an earlier outlook suggested that the probability of a strong uptrend was declining as upward momentum weakened.
Price action between October 5 and 8 further dampened expectations, while the subsequent rangebound movement contributed to growing disinterest. The rally between Tuesday and Wednesday briefly revived hopes of a stronger recovery.
Thursday’s decline has since revived concerns about further downside, reducing the optimism that accompanied the breakout above $2,500.
What Will Ethereum Do Next?
On the daily chart, ETH remains within the broader trading range established over the past two weeks. Although ETF inflows and improving on-chain indicators suggest that buyers have not completely withdrawn, their influence has so far been insufficient to establish a sustained breakout.
Derivatives data, meanwhile, point to persistent caution. Open interest has fallen to levels last seen in August, suggesting that positions have been closed and participation in the futures market may be declining. However, falling open interest alone does not establish whether traders are becoming more bearish or simply reducing their exposure.
The Taker Buy-Sell Ratio also remains below 1, indicating that aggressive selling is outweighing aggressive buying in the derivatives market. If this imbalance persists, it could place additional pressure on ETH’s $2,390 support.
A decisive breakdown below this level would weaken the current range structure and could expose the $2,100 area as the next downside target.
Nevertheless, the liquidation heatmap presents a potential alternative scenario. Following the two-day rally, relatively sparse liquidation clusters remain above $2,430. If ETH reclaims this level and buying momentum strengthens, the price could attempt another move toward $2,500.
The distinction is important: a move above $2,430 could signal a recovery attempt, but it would not by itself confirm a breakout from the broader trading range.
Overall, current on-chain indicators do not provide a definitive signal about ETH’s next direction. Instead, they suggest that buying interest has improved in some areas, while derivatives data continue to reflect selling pressure and uncertainty. At the time of writing, sellers appear to have the near-term advantage.
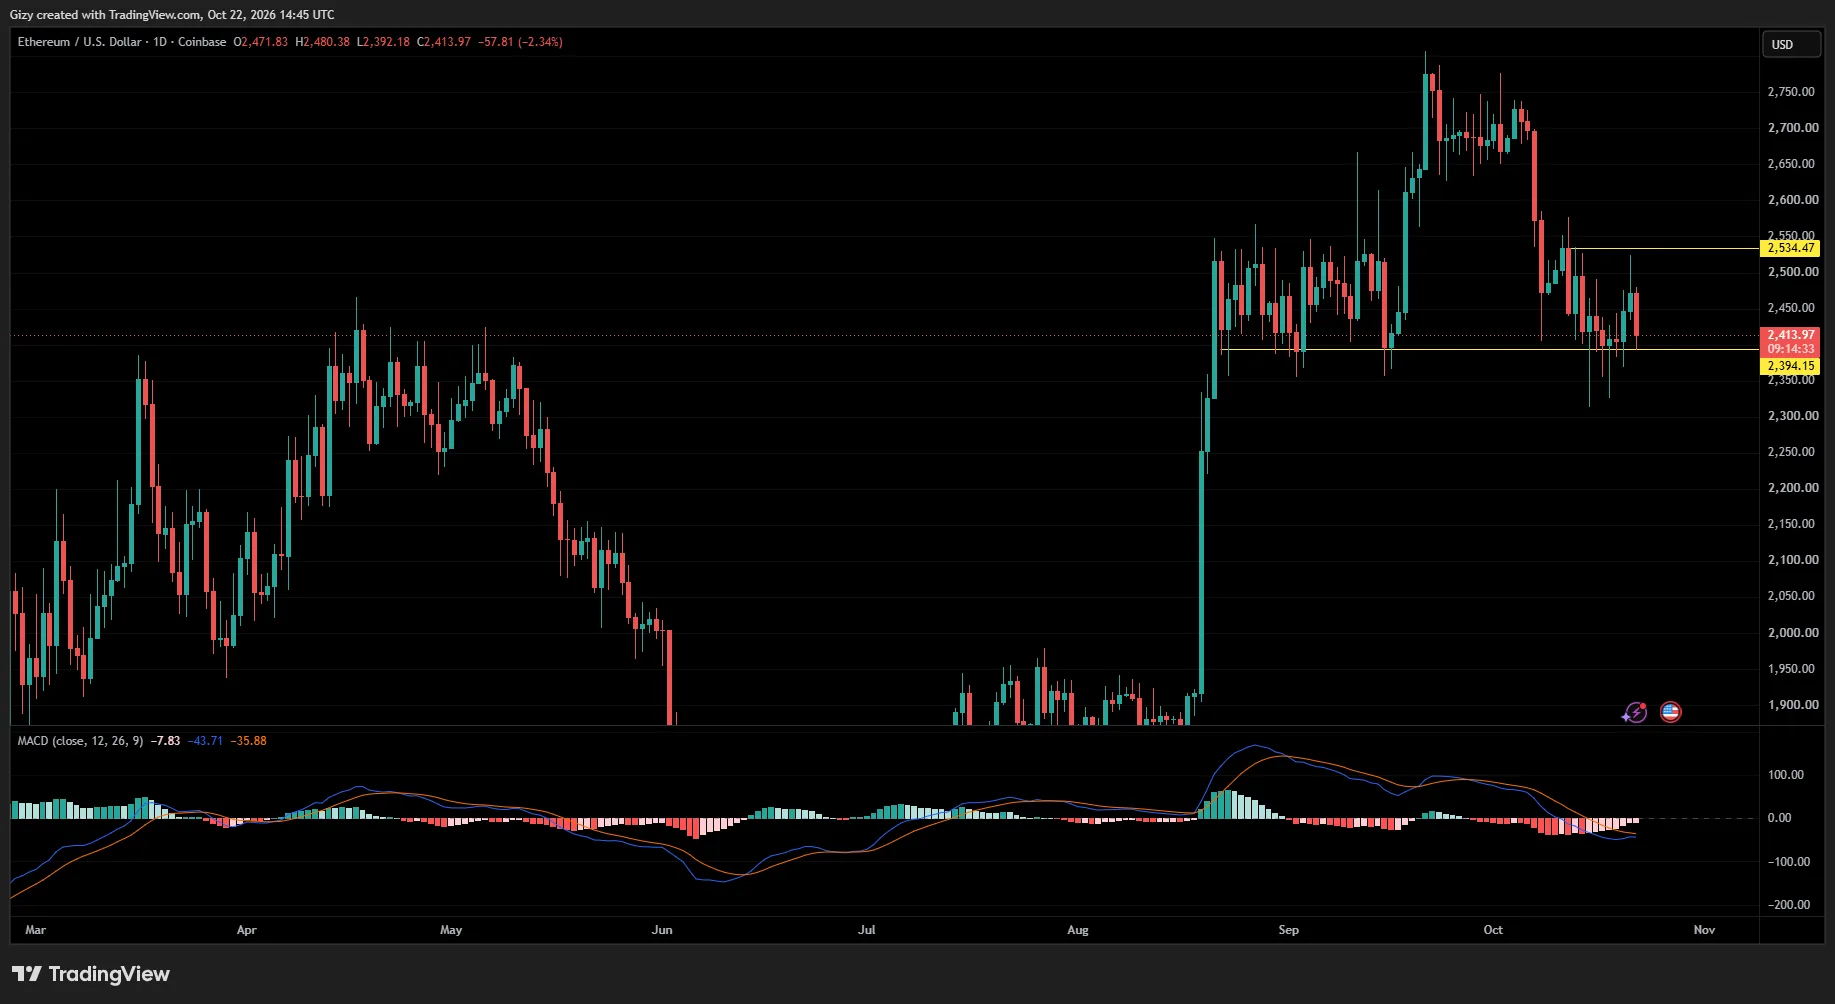
The daily chart also shows that ETH has yet to confirm a breakout from its recent consolidation. Although the Moving Average Convergence Divergence (MACD) indicator is generating a buy signal, this alone does not guarantee that prices will rise. Confirmation from price action and trading volume would strengthen the bullish case.
Ultimately, Ethereum has struggled to sustain its move above $2,500 after nearly two weeks of consolidation. A decisive daily close above $2,540 or below $2,390 would provide a clearer indication of the next directional move.
If ETH closes above $2,540 and sustains the breakout, the next potential target could be $2,700. Conversely, a confirmed breakdown below $2,390 could expose the $2,100 area.
For now, the market remains at a crossroads. Improving spot-market indicators offer some support for the bullish case, but persistent selling pressure means ETH still needs to reclaim key resistance before a stronger recovery can be confirmed.
The post Ethereum Wiped Off 2-day Gains. Why and What’s Next? appeared first on CoinTab News.
0
0

 Manage all your crypto, NFT and DeFi from one place
Securely connect the portfolio you’re using to start.
 Where will Ethereum trade next?
Live Polymarket and Kalshi odds on Ethereum price targets, compared side by side.
See Ethereum price odds


