
Will Ethereum Slip Below $2,100 This Week?

0
0

Ethereum is currently trading above $2,300 after slipping below the level a few hours ago. It is printing a doji on the 1-day chart as it grapples with muted trading volume.
However, the altcoin appears poised for a close similar to that of the previous session, which ended with notable price changes. The latest decline in volatility follows the previous week’s price action, during which ETH shed over 3% despite a significant uptrend.
A previous analysis explained why the coin retraced and what to expect next. It noted that despite the rally, the asset remained rangebound, leaving growing uncertainty about its next price move.
The analysis identified a critical breakout as a potential confirmation of the next price direction. Interestingly, this occurred on Saturday, when ETH recorded its first daily candle to open and close below $2,390 since August 25. Another candle appeared on Sunday, pushing prices even lower.
Following the loss of this barrier, the likelihood of further declines increased, and current on-chain metrics appear to support this outlook.
The first set of indicators to consider comes from the derivatives market. Interest in the altcoin appears to be waning as open interest on Hyperliquid crashes to fresh lows. Fewer positions are being maintained on the trading platform, with open interest falling to its lowest level since July 2025.
Even worse, the long/short ratio has also taken a hit. In recent months, this metric rose as investors anticipated further price increases. For example, it surged above 2 in July, indicating that long positions significantly outweighed short positions. Price action during this period showed that the sharp increase in the ratio coincided with a massive uptrend.
This time, however, the metric has dropped below 1. Based on the previous pattern, the altcoin may be gearing up for a significant retracement.
Ethereum ETF Outflows Persist
The previous week marked the third consecutive week in which ETH spot ETFs recorded negative net flows. The largest outflow occurred two weeks ago, while the latest weekly period ended with net outflows exceeding $220 million. The trend has continued into the new week, with the ETFs recording an outflow of $88 million on Monday.
ETF flows are worth watching because they can sometimes signal a potential change in market direction. The persistent outflows suggest that demand for ETH through these investment products remains weak, potentially adding to the pressure on prices.
Together, these metrics provide insight into current market sentiment. However, fundamentals could either improve or worsen the situation, and Ethereum faces several important economic events over the next two days.
The FOMC interest rate decision is high on the list, and uncertainty remains over what the Federal Reserve will do. If rates remain unchanged, ETH may see a muted reaction. However, a rate hike could trigger another decline. The likelihood of a sharp move is significant, given the asset’s muted price action since the start of the week.
For context, the previous rate hike announcement became a bullish catalyst as the market priced it in on Tuesday. Currently, there has been no comparable move, suggesting that a hawkish decision could trigger a notable downtrend.
Following Wednesday’s announcement, the PCE report is due on Thursday. The data could trigger an even steeper decline if inflation comes in higher than expected.
In a nutshell, the low trading volume over the last 48 hours suggests that these fundamental events could trigger a sharp move in either direction.
Key Levels to Watch
While the chances of further declines remain significant, Ethereum is also building a concentration of demand around a new price level.
On the 4-hour chart, the altcoin traded close to $2,300 for most of the last 48 hours. Interestingly, it has remained within the same zone since Saturday. The channel currently stretches between $2,370 and $2,295. Its consistent hold above short-term support makes this range worth watching.
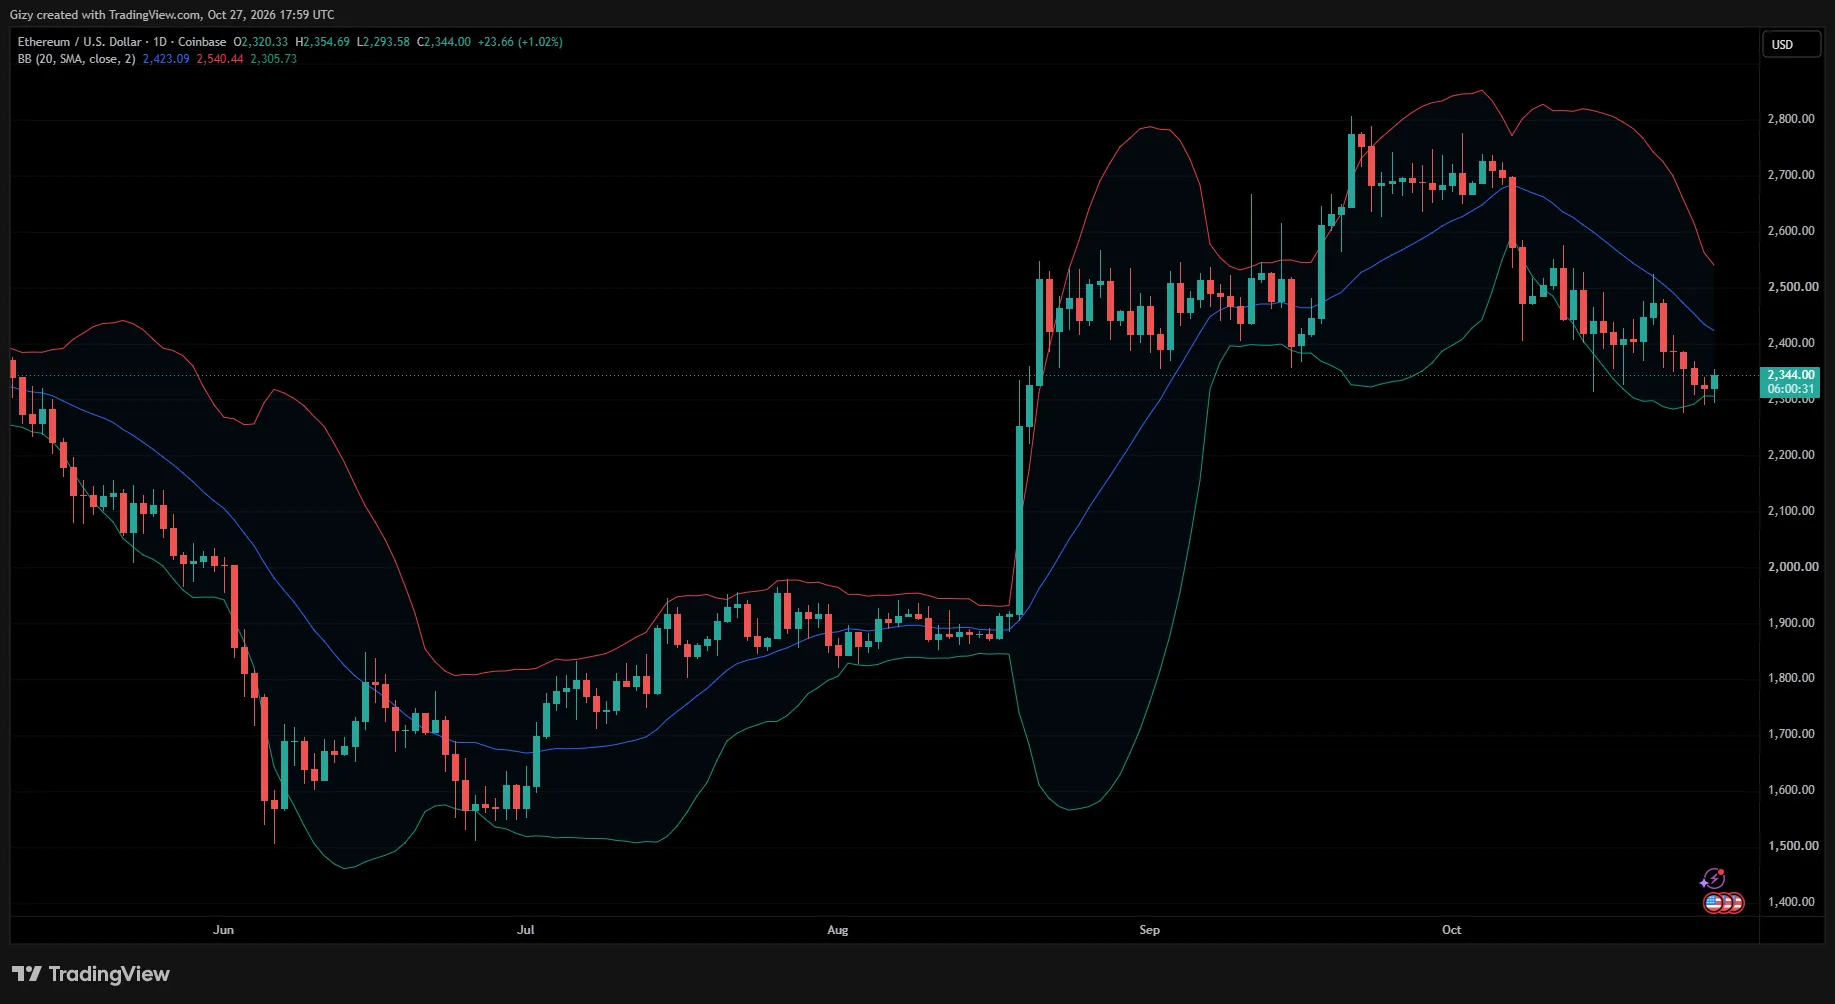
On the 1-day timeframe, ETH has turned green. Maintaining its current price would allow it to end its five-day losing streak. Even more interestingly, the asset may attempt to break out of the previously highlighted zone, potentially followed by a retest to reclaim $2,400.
Additionally, the Bollinger Bands suggest the possibility of further gains, as the coin is currently trading close to the lower band. Away from the charts, the liquidation heatmap shows a growing, dense cluster of long positions between $2,290 and $2,270.
Conversely, if the bulls fail to defend the $2,300 support, the asset could face a steeper decline. Looking at price action over the last six months, $2,270 is the next critical level. Losing this support could send Ether below $2,000. However, the 1-week chart shows notable demand concentration around $2,100.
The question now is whether the altcoin will retest the $2,100 support this week. It may not fall that low if selling pressure remains contained. Based on previous price movements, ETH could experience a 3% to 5% decline this week. Given this potential drop, a rebound around $2,200 is possible.
Ultimately, Ethereum faces a critical test around $2,300. A sustained hold above this level could support another attempt at $2,400, while a breakdown below $2,270 would bring the lower support zones into focus. If selling pressure intensifies, $2,100 remains an important level to watch, although a more moderate decline could see ETH find support around $2,200.
While investors remain uncertain about ETH’s next direction, the situation is also challenging for Ethereum Classic (ETC). After losing over 3% last week, the asset is now at a crossroads.
Ethereum Classic Trading at a Crossroads
The 1-week chart shows that ETC rebounded from the middle Bollinger Band last week and repeated the move on Monday. So far, the indicator has served as support, but repeated tests suggest that a break below this key level could have adverse consequences.
If this support fails, the asset could decline by 5% this week, with the next area of demand concentration around $7.10.
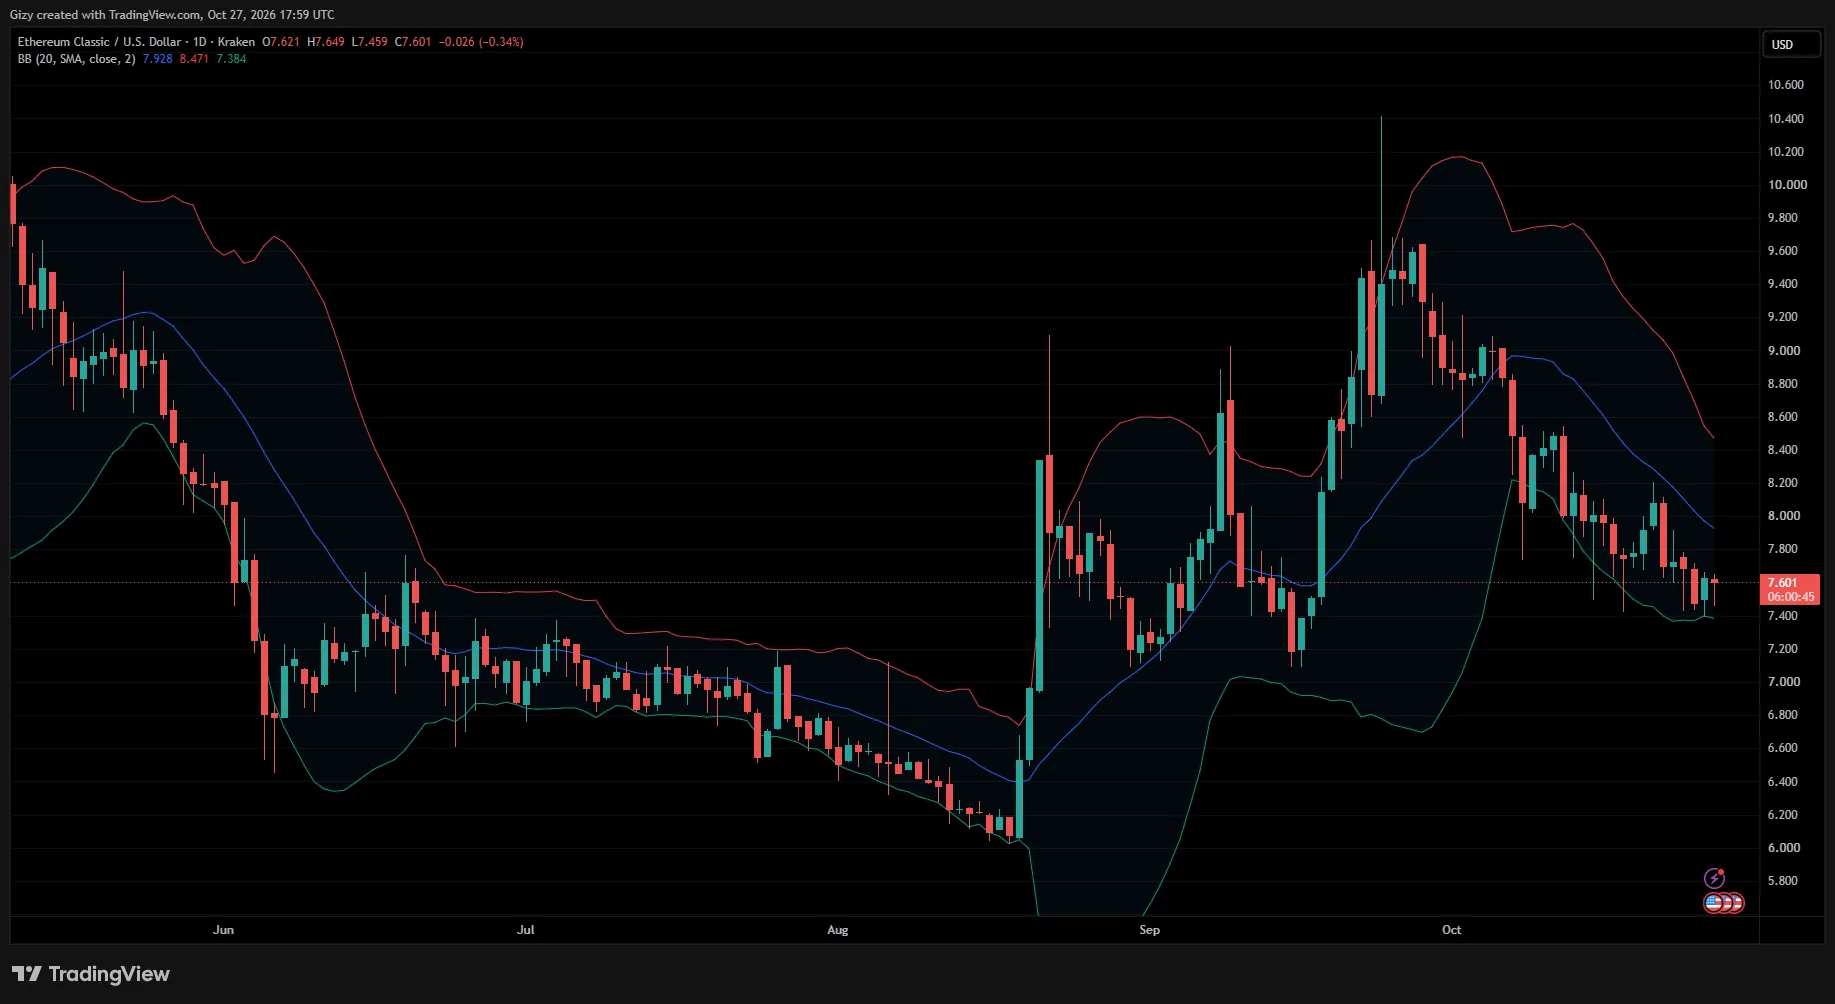
However, the Bollinger Bands currently present a more positive picture on the 1-day timeframe. ETC recently rebounded from the lower band. If the bulls sustain the upward momentum, the asset may retest the middle band near $8.
The post Will Ethereum Slip Below $2,100 This Week? appeared first on CoinTab News.
0
0

 Manage all your crypto, NFT and DeFi from one place
Securely connect the portfolio you’re using to start.
 Where will Ethereum trade next?
Live Polymarket and Kalshi odds on Ethereum price targets, compared side by side.
See Ethereum price odds


