
Ethereum price at $2,417 after 3.7 percent US inflation breaks the $2,495 level

0
0

The Ethereum price stands at around $2,417 on Wednesday afternoon, roughly 2,179 euros. That is a good four percent less than 24 hours earlier, and the slide carries a timestamp: at 12:30 p.m. Central European time the US Labor Department published consumer prices for September. The headline rate rose to 3.7 percent year on year, where 3.6 percent had been expected. The core rate excluding energy and food came in at 2.6 percent.
With that, the level that had held twice this week has gone. On Monday the price turned higher at $2,495.93; yesterday it was still at $2,534. Today it sits below, and the daily high of $2,524.82 dates from the hours before the figure.
The inflation figure in detail: a 3.7 percent headline rate, a 2.6 percent core rate
Consumer prices are the single most important date for rate expectations in the markets. The September reading of 3.7 percent sits a tenth of a point above what economists had expected on average, and it sits clearly above the US Federal Reserve's two percent target. The core rate of 2.6 percent is the figure the central bank watches more closely, because energy and food prices swing sharply and are barely steerable by monetary policy. The numbers are in the press release of the Bureau of Labor Statistics.
A tenth of a point sounds like little. For the futures market it is not, because what trades there is not the figure itself but its deviation from expectations. That deviation fell today against every asset that lives on cheap money.
How an inflation figure feeds through to the Ethereum price
The route from an American price statistic to a price in euros runs through three stations, and it takes minutes, not days.
First, rate expectations. If inflation falls faster than thought, the market counts on earlier rate cuts. If it rises more than thought, as today, the market pushes that expectation back. Second, the discount rate. A higher expected rate makes safe assets more attractive and at the same time makes every position running on credit more expensive. Third, leverage. Positions in the futures market carry margin; if the price falls below a certain threshold, they are closed automatically, which triggers further sell orders.
That third station explains why price moves after data releases often turn out steeper than the news itself warrants. It is not only people with a view on inflation who sell. Systems that have no view at all also close positions.
Twelve months of Ethereum: 41 percent below the level of a year ago
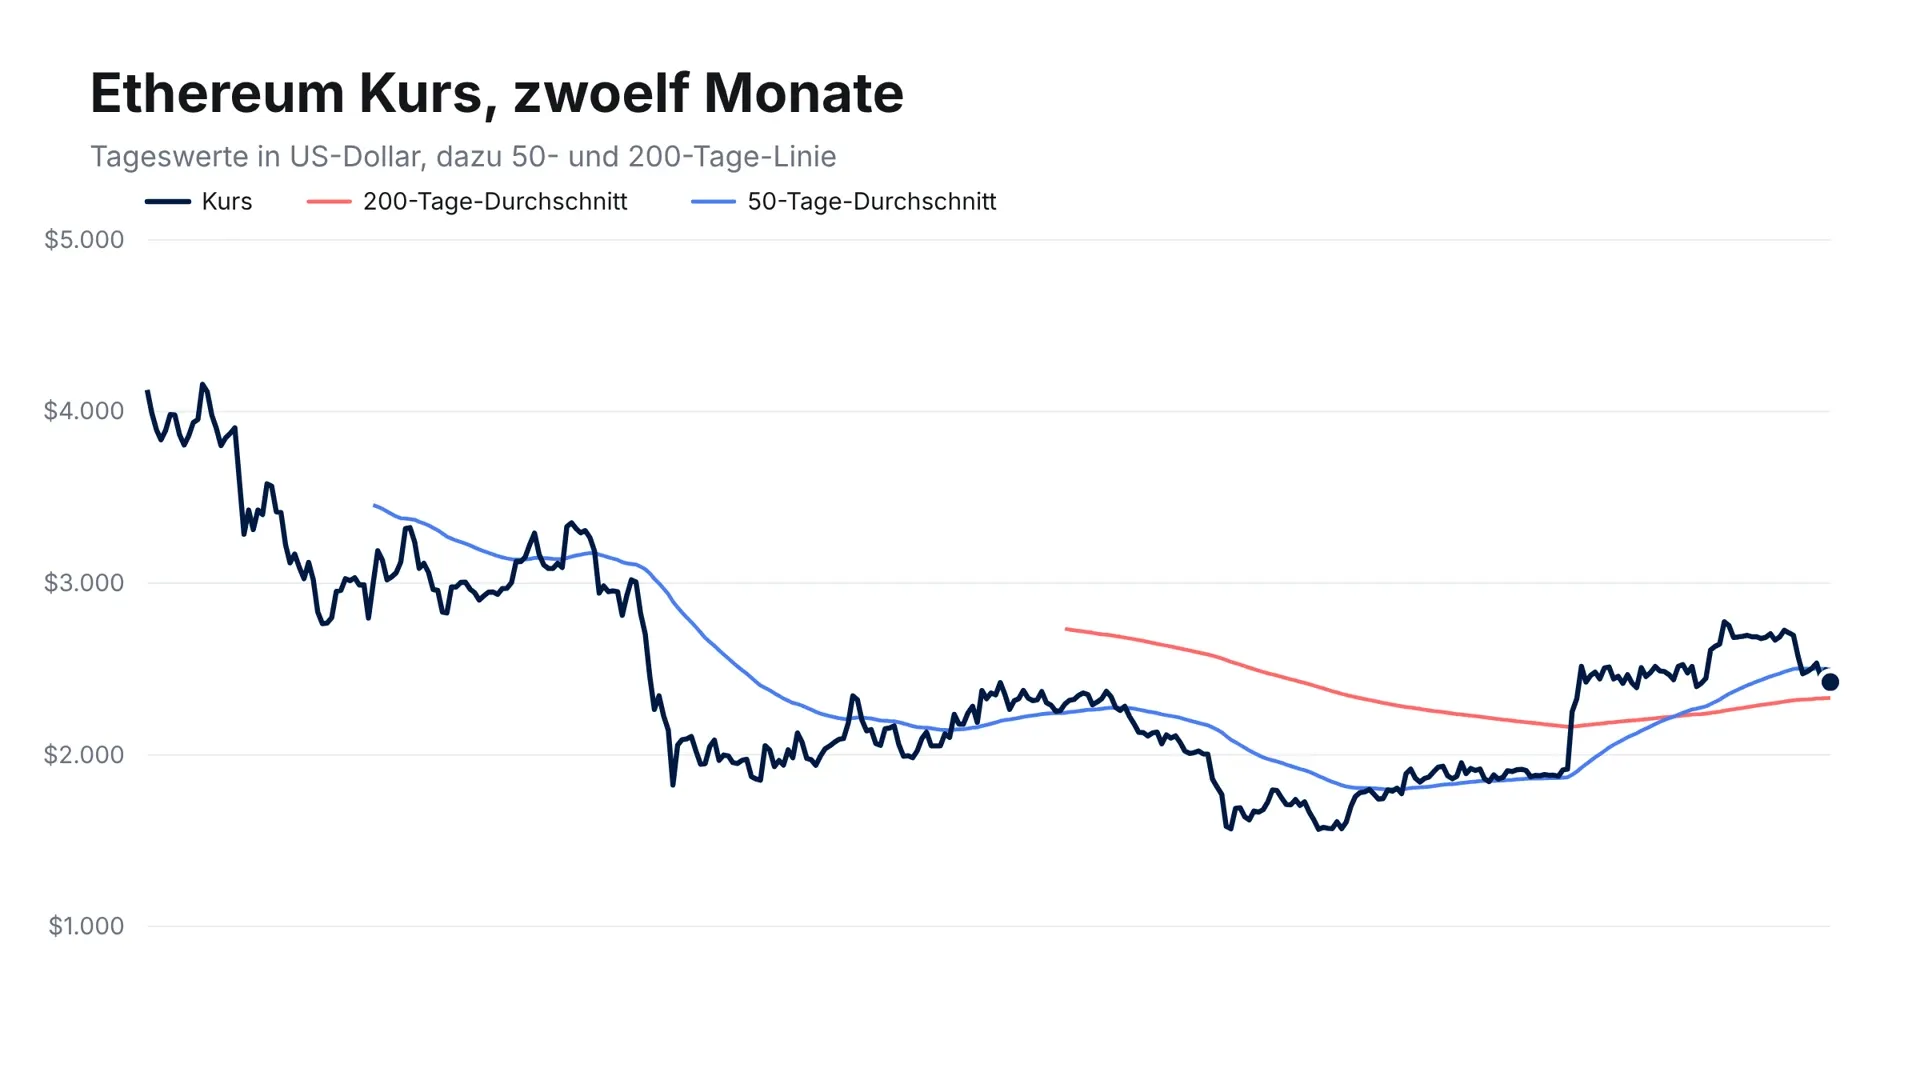
Today is one frame. To place it, we pulled the daily readings of the past twelve months from CoinGecko and charted them ourselves. A year ago Ethereum stood at $4,126, the one-year high at $4,159, the one-year low at $1,566. From the level of twelve months ago, today's price is around 41 percent away.
The chart also shows that the recovery since the one-year low was no straight line. Between $1,566 and today's level lies a rise of a good 54 percent, interrupted by several pullbacks.
The 50-day line and the 200-day line: the Ethereum price sits in between
Two moving averages place the price. By our calculation the 50-day average sits at $2,497, the 200-day average at $2,331. A moving average is the mean of the past 50 or 200 daily closing prices; it smooths the daily swings and shows the direction of the longer move.
Today's price of $2,417 therefore sits below the short line and above the long one. For the coming days those are the two numbers from which it can be read whether today's slide stays a one-day move or becomes more. Should the price fall below $2,331, that would be the first close beneath the 200-day line in weeks. Should it climb back above $2,497, today will be smudged out of the chart.
Tuesday's deleveraging and what has happened to the Ethereum price since
On Tuesday we described in this space that open positions in the futures market had fallen by 16 percent within five days; the price stood at $2,534 at the time. That is set out in our analysis of the deleveraging of 13 October.
Two things have changed since. The price sits around $117 lower, and the $2,495 level, which on Monday still served as a turning point, has been breached. The deleveraging itself works in the other direction: fewer open positions mean fewer forced closures when things go down. Today's slide of a good four percent is therefore remarkably shallow for a data release of this size.
ETF inflows: $24.8 million on Tuesday
Beside the chart, the fund flows are worth a look, and right now they tell a different story from the price. Around $24.8 million net flowed into the American spot ETFs on Ether on Tuesday, according to market data. That is a small sum measured against the outflows of previous weeks, but it is a change of sign: in early October a single week showed $542 million of outflows on the books.
For investors in Germany these products are not directly accessible; comparable investments run here as ETNs or ETPs via the exchange. What works in Europe and what does not is covered in our overview of crypto ETFs and their European equivalents. The reason the American numbers count anyway: this data is the only daily published indicator of whether big money is flowing in or out.

28 October as the next date in the calendar for the Ethereum price
The Federal Reserve's next monetary policy meeting falls on 27 and 28 October 2026, with the decision published on the second day. The dates are in the official meeting calendar of the Federal Reserve. Until then, today's inflation figure is the most recent hard data point on which expectations rest.
In practice that means the market works with this one figure for two weeks. Anyone trading larger amounts in that time does better to reckon that 28 October will be a day of elevated swings, as this afternoon was.
Buying under MiCA: which exchanges are authorised in Germany
Since the European crypto regulation MiCA came into force, every provider addressing retail clients in Germany needs authorisation as a crypto asset service provider. Authorisation is the first check before any purchase: if the provider is in the register of BaFin or another European supervisor, the European rules on custody and client funds apply. If it is not there, they do not. Which houses hold the authorisation and what they charge for an Ethereum purchase is shown by our comparison of crypto exchanges for European investors.
The second point is custody. Ether sitting on an exchange belongs to you economically, but technically the exchange manages the keys. Anyone holding larger amounts and not trading them usually withdraws them to a wallet of their own.
Holding period and tax: what 31 December means for German investors
A price slide in Germany is also a tax question, and in both directions. Gains from selling Ether are tax-free under section 23 of the Income Tax Act if more than one year lies between purchase and sale. Within that year they are taxable as a private disposal transaction, with an exemption threshold of 1,000 euros per calendar year. Threshold means: if it is exceeded, the entire gain is taxable, not only the part above it.
That gives a concrete cut-off date. Losses from private disposal transactions can only be offset against gains of the same kind, and the calendar year ends on 31 December. Anyone who has realised gains within the one-year period this year and is currently sitting on loss positions has until then to bring both together in the same year. Anyone close to the end of the one-year period, by contrast, gives away the tax exemption with a sale now.
Which acquisition happened when can only be answered, with several purchases, from a clean record. The common tools for that are in our comparison of crypto tax software and portfolio trackers. These details place the legal position and replace no tax advice.
Staking: a 2.66 percent network yield and the question of the holding period
Stake your Ether, meaning put it to work securing the blockchain, and you receive a payment for it. The network most recently paid around 2.66 percent a year; at the providers, a good 2.2 percent arrives after fees. How the providers differ is broken down in our comparison of staking providers.
For tax purposes staking is to be viewed on its own: the running income is taxable as other income as soon as it is received. The one-year holding period for the staked Ether itself is untouched by that under the current view of the tax authorities.
Our assessment: the market is pushing back the rate turn, not the Ethereum story
In the editorial team's view today's move was a reaction to a tenth of a point, not to Ethereum itself. Three observations support that. First, the whole market fell with it: Bitcoin gave up around two percent the same afternoon, Solana a good four. Second, ETF flows have been slightly positive again since Tuesday, which argues against a flight out of Ether. Third, the level of leverage after last week's unwinding is lower than in the summer, and the daily loss still stayed in single digits.
Against it stands the fact that the $2,495 level has now been tested twice and breached on the third attempt. A level loses force the more often it is approached. As long as the market reckons with later rate cuts, the price lacks the fuel for the way back above the 50-day line at $2,497. This is an assessment of the situation and not a recommendation to buy or sell; crypto investments can lead to a total loss.
Ethereum at $2,417: without a rate turn the push above $2,500 is missing
Three things decide the price over the coming two weeks, and all three can be read off a single number.
- The $2,331 line. A daily close below it would be the first time in weeks that the price loses the long average line. If you want to buy, the authorised venues are among the authorised exchanges named above.
- 28 October. The Federal Reserve's rate decision is the next date that either confirms today's figure or devalues it.
- 31 December. The tax year ends, and with it the chance to offset gains and losses of the same year. The tools for that are in the tax software comparison.
(As of October 14, 2026. This article is not investment advice. Prices and fee structures change; check the terms with the provider before you buy.)
0
0

 Manage all your crypto, NFT and DeFi from one place
Securely connect the portfolio you’re using to start.
 Where will Ethereum trade next?
Live Polymarket and Kalshi odds on Ethereum price targets, compared side by side.
See Ethereum price odds


