
Ethereum Holds $2,400 While Analyst Flags a $25,000 Triangle Target

0
0

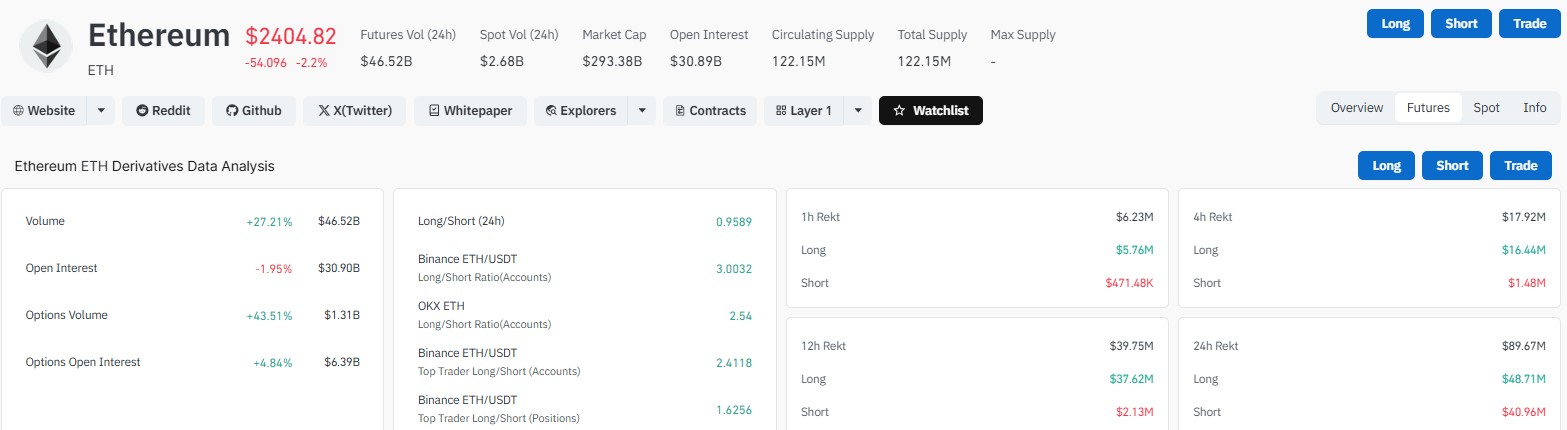
Ethereum is trading at $2,404.82, down 2.2% on the day. That is a drop of about $54, according to CoinGlass.
Derivatives activity is rising even as the price slips. Futures volume jumped 27.21% to $46.52 billion.
Traders now watch one resistance level and one support zone.
What Is the ETH Price Today?
ETH trades at $2,404.82 with a market cap of $293.38 billion. Spot volume is $2.68 billion, and circulating supply is 122.15 million ETH.
On the Binance daily chart, ETH showed $2,444.58, down 1.18%. The gap comes from different times of day.
Why Is Ethereum Down Today?
The data gives clues, not one clear cause. Futures volume rose 27.21%, while open interest fell 1.95%. That mix can mean traders are closing bets.
Options moved the other way, with volume up 43.51%.
Derivatives Metric | Change | Value |
Futures volume | +27.21% | $46.52B |
Open interest | -1.95% | $30.90B |
Options volume | +43.51% | $1.31B |
Options open interest | +4.84% | $6.39B |
What Is the ETH Long/Short Ratio?
The 24-hour ratio is 0.9589, a slight lean toward shorts. Account ratios differ: Binance ETH/USDT shows 3.0032, and OKX shows 2.54.
Binance top traders read 2.4118 by accounts and 1.6256 by positions. The crowd leans long, but big positions are less lopsided.
How Much ETH Was Liquidated in 24 Hours?
Total liquidations reached $89.67 million. Longs lost $48.71 million, and shorts lost $40.96 million.
Over the last 12 hours, longs lost $37.62 million against $2.13 million for shorts. Most short wipeouts likely came earlier, before price turned lower.
Window | Total | Long | Short |
1 hour | $6.23M | $5.76M | $471.48K |
4 hours | $17.92M | $16.44M | $1.48M |
12 hours | $39.75M | $37.62M | $2.13M |
24 hours | $89.67M | $48.71M | $40.96M |
Are Ethereum ETFs Seeing Inflows?
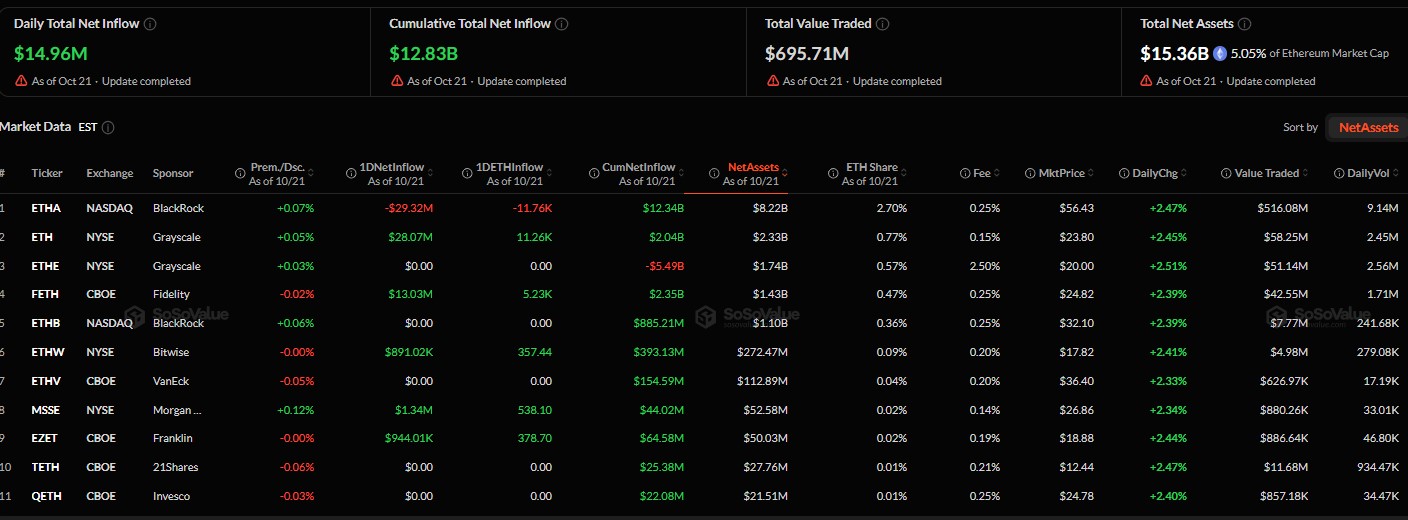
Yes, but unevenly. SoSoValue data as of Oct 21 shows $14.96 million in net inflows for U.S. spot ETH ETFs.
BlackRock's ETHA lost $29.32 million, yet it still holds $8.22 billion in assets. Grayscale's Mini Trust led with $28.07 million.
Total net assets are $15.36 billion, or 5.05% of ETH market cap. Cumulative inflow is $12.83 billion.
Fund | Sponsor | 1-Day Flow | Net Assets |
ETHA | BlackRock | -$29.32M | $8.22B |
ETH | Grayscale | +$28.07M | $2.33B |
FETH | Fidelity | +$13.03M | $1.43B |
ETHW | Bitwise | +$891.02K | $272.47M |
What Are the Key ETH Support and Resistance Levels?
On the daily chart, resistance sits at $2,541.63. ETH has been rejected near it more than once.
Support is a zone roughly between $2,350 and $2,370. A rising trendline from the June low near $1,500 runs just below.
RSI reads 43.17, above its average of 40.50 but under 50. Momentum looks soft, not oversold.
What Is the Busted Ascending Triangle on ETH?
Analyst Trader Tardigrade (@TATrader_Alan) shared a monthly chart on X. It shows a busted ascending triangle forming for nearly five years.
The pattern appears when price slips under support, then snaps back. On the chart, ETH made a false breakdown and recovered.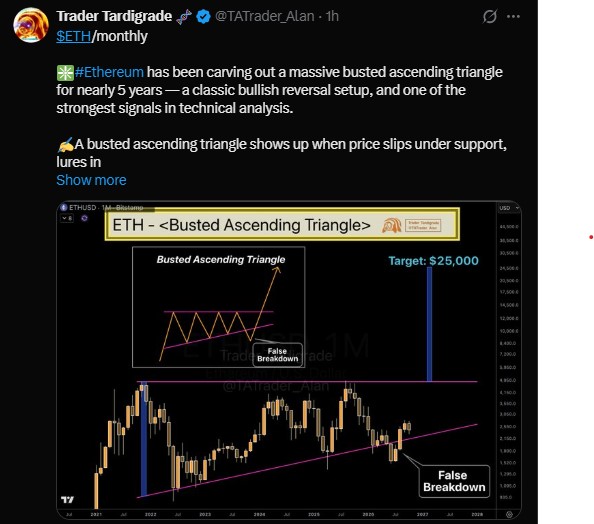
Can ETH Reach $25,000?
The chart marks $25,000 as the target. That is more than 10 times today's price.
It is one analyst's view, and nothing is confirmed. The near-term test is smaller: ETH must handle $2,541.63 first.
What Is the ETH Outlook for the Coming Weeks?
Bulls need a daily close above $2,541.63. Bears are watching the support zone and the trendline below it.
The signals do not agree. ETF inflows help the bulls, while the 0.9589 ratio, soft RSI, and long liquidations favor caution.
Anything can change fast in crypto.
Disclaimer
This article is for information only and is not financial advice. Crypto prices are volatile, and you can lose some or all of your money. Do your own research and speak with a licensed financial advisor before you trade or invest.
0
0

 Manage all your crypto, NFT and DeFi from one place
Securely connect the portfolio you’re using to start.
 Where will Ethereum trade next?
Live Polymarket and Kalshi odds on Ethereum price targets, compared side by side.
See Ethereum price odds


