
Ethereum’s Next Move Could Catch the Market Off Guard — Watch These Signals

0
0

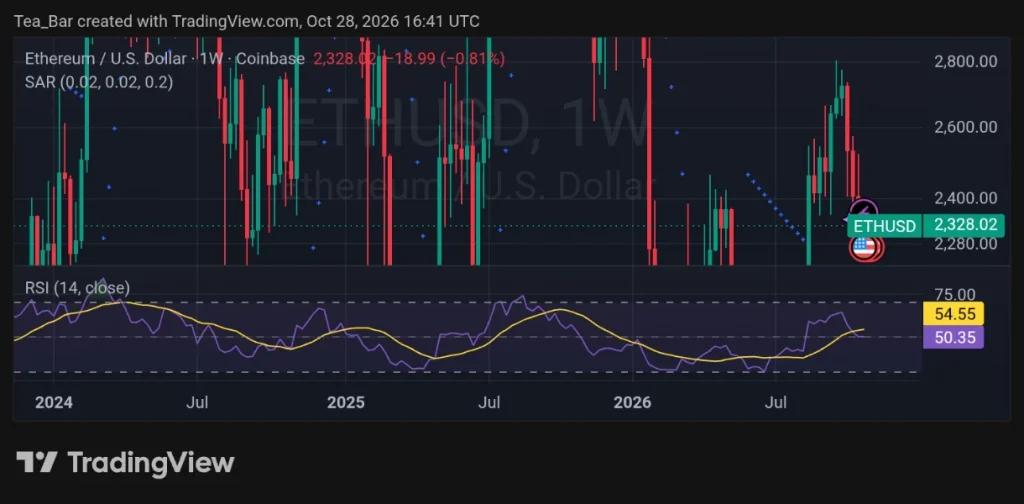
Ethereum is consolidating in a zone that has repeatedly acted as a pivot over the past year. As of October 28, 2026 (16:41 UTC), the weekly chart shows ETH trading near $2,328, down a modest 0.81% on the week.
The structure is neither strongly bullish nor clearly broken, which is precisely why the next directional move could catch many participants off guard.
Weekly Structure Still Holds Key Levels
The weekly candles reveal a market that has been chopping between roughly $2,200 and $2,800 for an extended period. Price recently pulled back from higher levels and is now sitting near the middle of that range.
Parabolic SAR dots have been tracking the recent decline, but they have not yet flipped decisively into a sustained downtrend. This leaves the door open for either a rebound or a deeper test of support.
TechGaged has previously examined Ethereum’s weekly market structure, providing additional context for traders watching key support and resistance levels.
RSI Offers a Neutral but Watchable Reading
The 14-period RSI on the weekly timeframe is currently hovering around the 50–55 zone.
One line sits near 54.55 while the other tracks closer to 50.35. This mid-range positioning suggests momentum is neither overbought nor oversold.
Historically, sustained moves in either direction on Ethereum’s weekly chart have often begun when RSI breaks clearly above 60 or slips below 45. The current neutral reading means the market is still searching for a catalyst.
What Could Trigger the Next Leg
Two signals stand out on this timeframe. First, a weekly close above the recent local highs near $2,400–$2,450 would likely force short covering and open the path toward the upper end of the multi-month range.
Second, a decisive break and close below the $2,200–$2,250 support cluster would shift the structure more clearly bearish and could accelerate selling.
Because the weekly RSI remains balanced and the price is not extended in either direction, any strong catalyst — regulatory clarity, ETF flow shifts, or broader risk appetite — has the potential to produce a sharper move than many currently expect.
A Market Poised for Surprise
Ethereum’s weekly chart as of late October 2026 shows a market in equilibrium. The next sustained move, whether higher or lower, may arrive with more force than the recent quiet price action suggests.
Traders watching the $2,200 support and $2,450 resistance levels, along with weekly RSI behavior, are likely to be better prepared when that shift arrives.
Disclaimer:
This article is for informational purposes only and does not constitute financial, investment, or trading advice. The views expressed are based on publicly available data, market observations, and the author’s interpretation at the time of writing. Cryptocurrency markets are highly volatile and unpredictable, and past performance or current technical setups do not guarantee future results. Readers should conduct their own research and consult with a qualified financial advisor before making any investment decisions. TechGaged does not accept liability for any losses incurred based on the information presented.
The post Ethereum’s Next Move Could Catch the Market Off Guard — Watch These Signals appeared first on TechGaged.
0
0

 Manage all your crypto, NFT and DeFi from one place
Securely connect the portfolio you’re using to start.
 Where will Ethereum trade next?
Live Polymarket and Kalshi odds on Ethereum price targets, compared side by side.
See Ethereum price odds


