
Hyperliquid Price Prediction: Can HYPE Survive Hot CPI at $70.45?

0
0

Is this the bounce, or just a pause before $57.879?
Sellers dragged the token from a $97.19 spike to $71.65, and this Hyperliquid price prediction starts on a falling wedge floor. The earlier $76 hold call matters less now, since $76.451 flipped into overhead resistance.
Any HYPE price prediction hinges on $70.455, where buyers stood at 08:47 UTC. RSI reads 35.03.
Hot CPI Hit at 13:30 UTC: Why Is HYPE Down Today?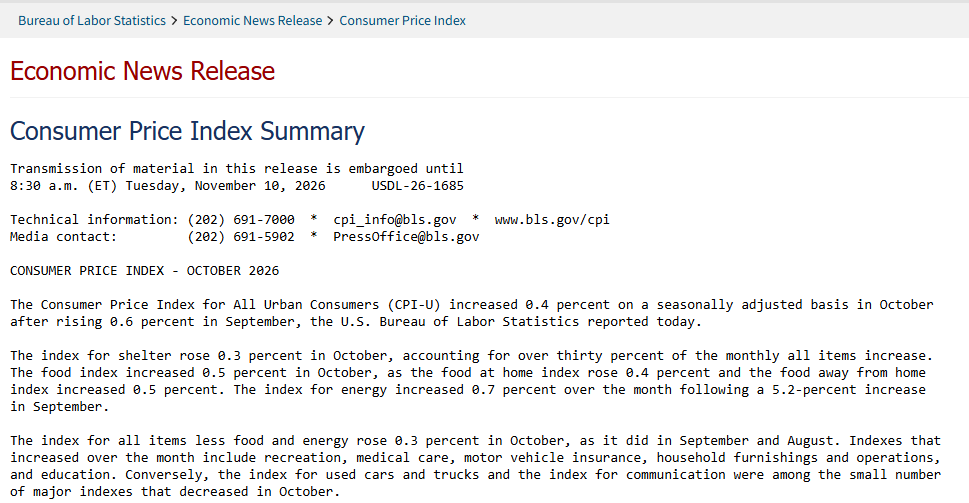
Inflation ran hot. The October CPI rose 0.4% after 0.6% in September, per the October CPI release from the Bureau of Labor Statistics on Nov 10, 2026, at 13:30 UTC.
Energy jumped 0.7%; food added 0.5%. Core, which strips out both, rose 0.3%.
Bitcoin slipped 1.16% to $73,688.91. But HYPE fell 3.39%, about 2.9 times as much.
HYPE Price Today: Data Snapshot
Metric | Value (Nov 11, 2026, 08:47 UTC) |
Price | $71.65 |
24h change | -3.39% |
24h range | $70.44 to $75.24 |
Market cap | $18.12B |
Fully diluted valuation | $68.06B |
24h volume | $1.48B |
Open interest | $3.23B |
Volume rose 28.19% while price slid, so sellers had real size, per CoinMarketCap data. Open interest is the value of all open futures contracts.
Long Liquidations Hit $15.14M
Longs paid. CoinGlass liquidation data shows $15.14M liquidated in 24 hours, 93% of it longs.
That reads like capitulation. Actually, that's too quick, because open interest fell only 3.56%, and most margin positions are still open.
And spot volume jumped 54.53% to $345.09M, while futures volume slid 6.43%.
HYPE Technical Analysis: How the Falling Wedge Formed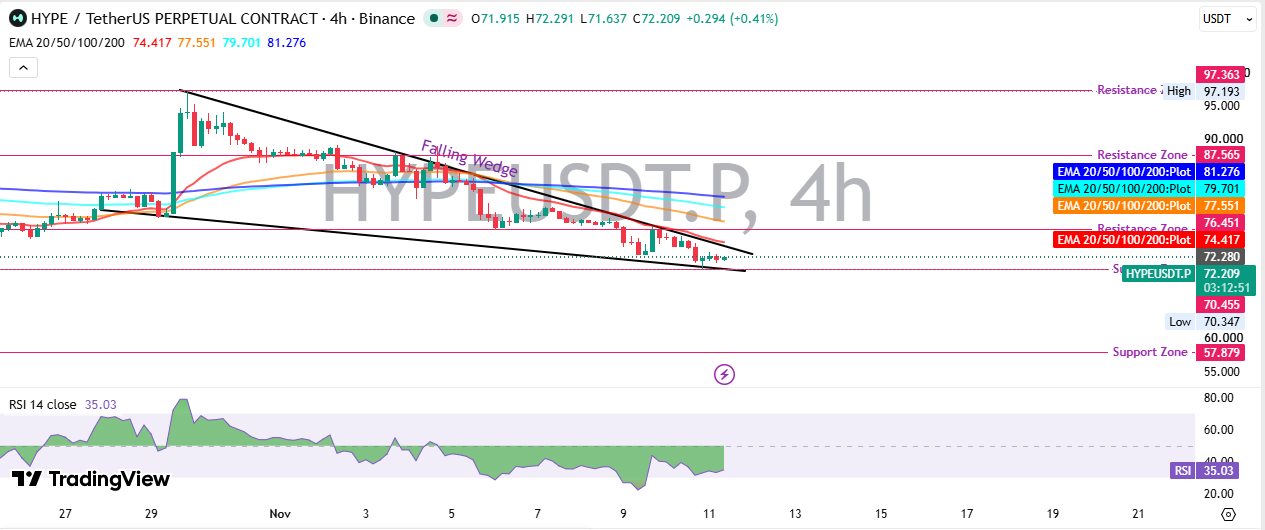
The TradingView 4-hour chart of the Binance perpetual starts with a quiet base in the high $70s. This Hyperliquid price analysis treats that base as the launchpad.
Then buyers went vertical, and a tall run of green candles tagged the $97.19 level. That peak became the top of the wedge.
Sellers answered fast. Every bounce stalled lower, first at $87.565.
An EMA is an average that weights recent prices more. The 20 EMA sits at $74.417, the 50 EMA at $77.551, the 100 EMA at $79.701, and the 200 EMA at $81.276, a bearish stack.
RSI slid under 30 on the sharpest leg and reads 35.03 now.
The latest candles are tiny, with a $70.347 low and price at $72.209 on the lower wedge line. A falling wedge can resolve upward, yet. Not before price trades above $74.417.
Hyperliquid Price Projection: Support and Resistance
A Hyperliquid price projection starts with the ceiling. Resistance builds at $74.417, $76.451, $77.551 and $79.701.
The $97.363 peak sits where the earlier ICE flag setup formed, with $87.565 in between.
Support is thin. $70.455 comes first, then air down to $57.879.
And that gap is why a failed floor would hurt.
HYPE ETF Flows: Zero Inflow, Heavy Losses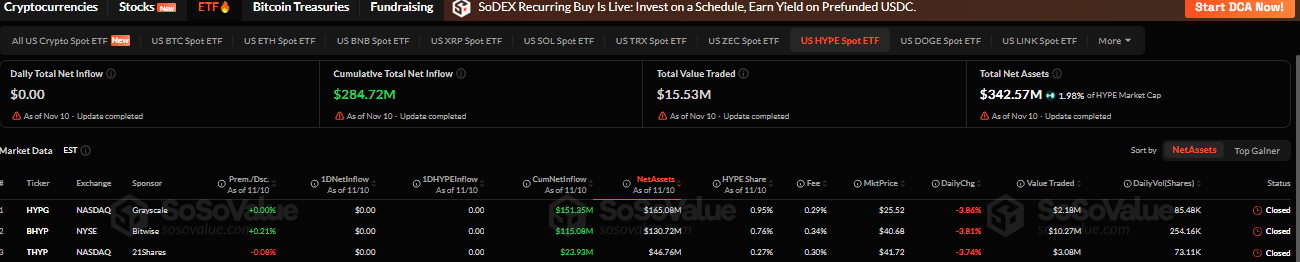
The American spot HYPE ETF group logged $0.00 net inflow on its latest daily print, per SoSoValue ETF data.
Net assets sit at $342.57M, or 1.98% of market cap, and Greyscale Plus Bitwise holds $295.80M of that. Every fund fell between 3.74% and 3.86%.
So who buys the next dip?
Supply Gap: Which Market Cap Is Real?
CoinMarketCap counts 252.93M tokens in circulation. The Hyperliquid explorer token page shows 301,757,989.
That 48.83M gap nearly matches a wallet holding 48,820,395 non-circulating tokens. But another address holds 238,161,588 with the same tag, so float math depends on what moves.
Market cap reads $18.12B on one source and $21.75B on the other.
Futures Still Outweigh Spot Buyers
Futures volume of $2.17B runs about 6.3 times the spot volume of $345.09M, so borrowed money drives these swings.
Funding, the fee one side pays the other to keep perpetual prices near spot, sits at 0.0099%, or 10.8% annualised. Longs still pay shorts, which means. Dip buyers haven't left.
Big wallets bought dips before, as the earlier whale buy report tracked.
Hyperliquid Price Outlook: Scenario Table
This Hyperliquid price prediction leans bearish under $74.417, and the Hyperliquid price outlook flips only above $76.451. Other coins get the same table in the price prediction hub.
Scenario | Trigger | Target | Invalidation | Liquidity Condition |
Bull | Trading above $76.451 | $79.701, then $81.276 | Trading under $70.455 | Futures volume above $2.17B, ETF net inflow positive |
Base | Range between $70.455 and $74.417 | $72.44 midpoint | Break of either edge | Futures volume near $2.17B, ETF net inflow at $0.00 |
Bear | Trading under $70.455 | $57.879 | Reclaim of $74.417 | Long liquidations above $15.14M, open interest under $3.23B |
Hyperliquid Price Prediction: 24 Hours, 7 Days, 30 Days
Next 24 Hours
Expect a grind between $70.455 and $74.417 while volume sits near $1.48B.
Next 7 Days
This Hyperliquid price forecast needs a trade above $76.451 before $79.701 matters. Without it, the $72.44 midpoint pulls.
Next 30 Days
A wedge breakup targets $81.276, and a breakdown targets $57.879. The earlier November outlook covers the wider month.
Risks That Can Break This HYPE Price Prediction
Another hot inflation print would hit risk assets again. Zero ETF inflow means no fresh fund demand behind $70.455.
Supply data differs by source, as the earlier supply gap analysis showed.
And a clean break under $70.455 would be ugly, with nothing marked until $57.879.
Final Verdict
This Hyperliquid price prediction stays bearish below $74.417 and turns constructive only above $76.451. Under $70.455, sellers get $57.879.
Positive ETF net inflow would be the first sign buyers are back, and the latest crypto news page will show it fast.
Disclaimer: This article is for information only and isn't financial advice. Crypto assets are highly volatile, and prices can move sharply in either direction. Do independent research and weigh personal risk tolerance before trading.
0
0


 Manage all your crypto, NFT and DeFi from one place
Securely connect the portfolio you’re using to start.


