
Chainlink Price Prediction: Is LINK Coiling Before a Breakout?

0
0

Is Chainlink building pressure for a breakout, or just running out of buyers?
Volume fell 22.26% overnight, and last week's record ETF inflow already feels distant. Still, this Chainlink price prediction now hangs on one tight band, with the $LINK price today at $12.96.
Chainlink's technical analysis shows the price stuck between short and long moving averages. Pressure builds. But the direction is still open.
Chainlink Price Prediction: What's Happening Now
Current Price and 24H Performance
Chainlink trades at $12.96, up 0.27% in 24 hours, per CoinMarketCap live data. Data time: Oct 14, 2026, 05:00 UTC. The 24-hour range ran from $12.74 to $13.16. Narrow.
And the weekly picture is rougher, with a 7-day drop of 7.03%, though the 30-day gain still reads 15.85%, per CoinGlass.
Trading Volume and Market Cap
Volume slid 22.26% to $286.3M, while market cap sits at $9.69B. Chainlink ranks #13. Volume equals only 2.95% of market cap, which is light action for a top 15 coin.
Supply and All-Time High
Circulating supply is 748.09M LINK out of a 1B maximum, and the LINK staking update covers part of what's locked up.
The price still trades 75.45% under the $52.88 peak from May 10, 2021. Long road back.
Why Is $LINK Moving Today?
Barely moving. That's the headline. Spot volume is fading. Liquidations stayed tiny. No spark yet.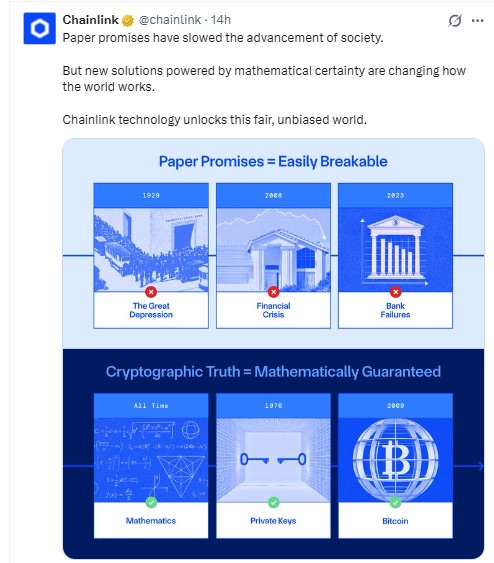
Sentiment posts keep coming, like Chainlink's X post on paper promises versus cryptographic proof. Marketing, not a catalyst.
Chainlink Technical Analysis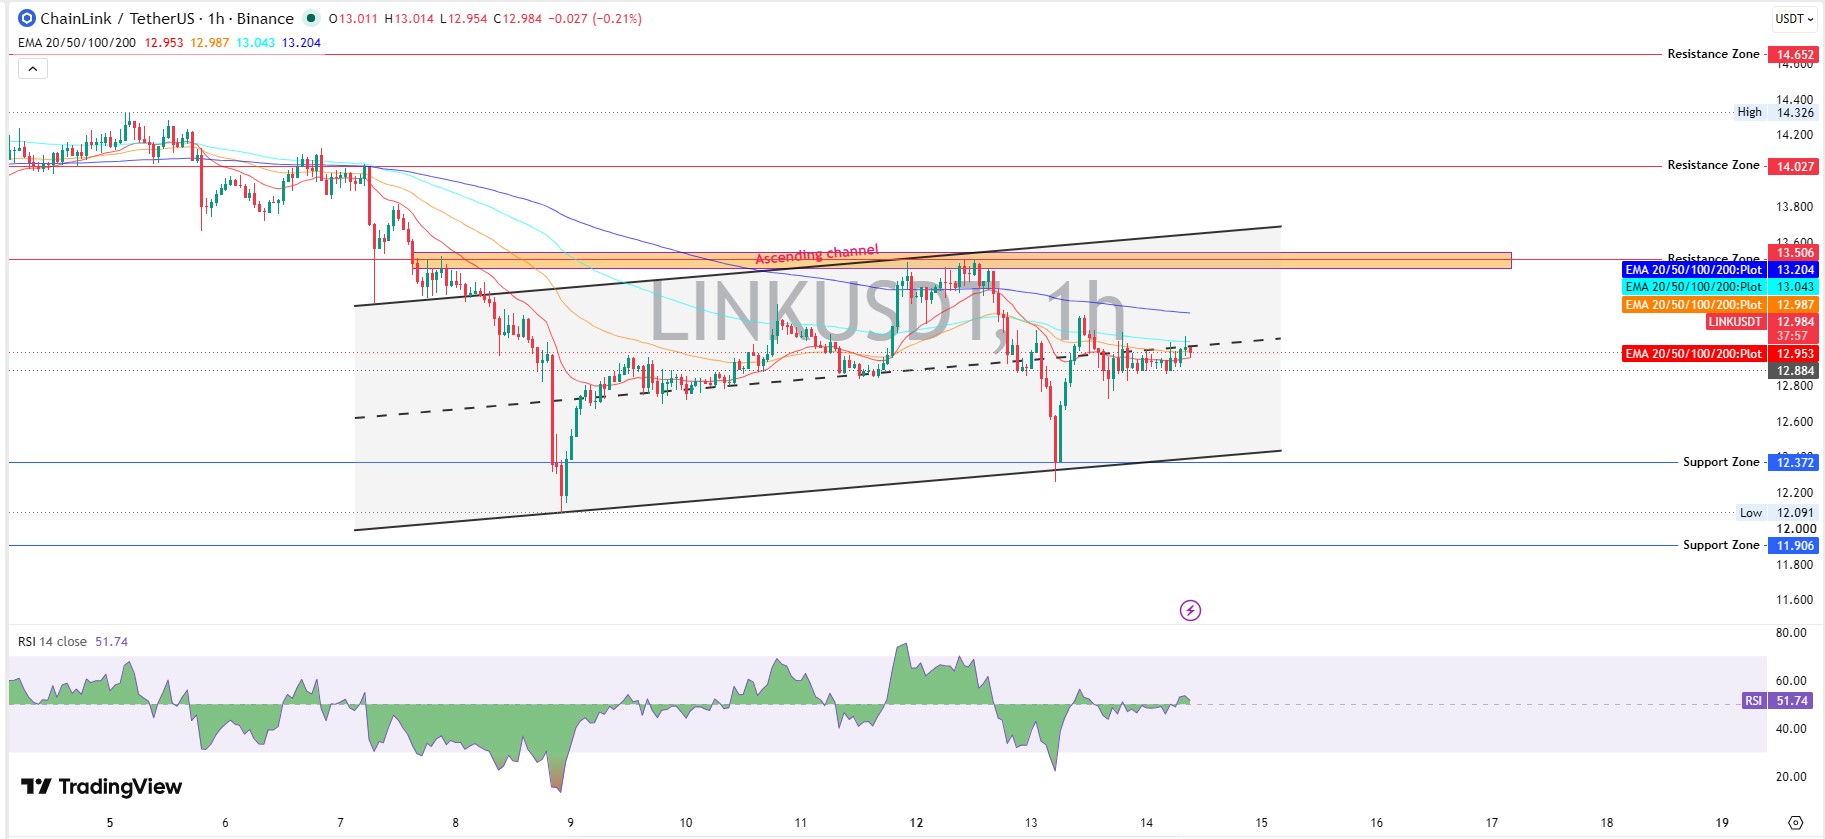
The 1-hour Binance chart shows a rising channel. Buyers defended the lower line near $12.091 earlier this week.
RSI reads 51.74, a flat middle, per TradingView chart data.
EMA means exponential moving average, a trend line that weights recent trades more heavily. The 20 EMA sits at $12.953 and the 50 EMA at $12.987, both hugging the price.
But the 100 EMA ($13.043) and 200 EMA ($13.204) sit overhead, capping rallies.
That reads bearish. Then again, RSI at 51.74 isn't screaming weakness, so cautious neutral is closer. Still, trades below the 200 EMA tilt the bias down.
Key Support Levels
LINK support and resistance starts below price, with $12.372 at the channel base, about 4.5% lower. Next comes $11.906, roughly 8.1% under, and that zone featured in the earlier channel test. Lose $12.372, and sellers get room.
Key Resistance Levels
Resistance begins at the 200 EMA near $13.204, then the supply zone at $13.506, an area where sellers stepped in before. Above that, $14.027 and $14.652 mark the next ceilings.
Chainlink ETF Inflows
Daily Flow Numbers
Chainlink ETF inflows fell to $0 on Oct 13, 2026, per SoSoValue ETF data, after $1.18M on Oct 12 and $9.48M on Oct 9.
Cumulative net inflow stands at $179.61M, and net assets reached $229.38M, about 2.37% of LINK's market cap.
Grayscale and Bitwise Funds
GLNK holds $166.72M, and CLNK holds $62.66M. Both trade at small discounts of 0.10% and 0.38%, meaning shares cost slightly less than their holdings. Mild, not panic. The DTCC news update covers the earlier institutional angle.
LINK Derivatives Data
Futures volume reached $408.41M against $65.48M in spot, per CoinGlass derivatives data. Open interest, the total value of open futures contracts, is $608.46M.
The long/short ratio compares accounts betting up with those betting down. Binance reads 1.5988, and OKX shows 2.5. Crowded longs, thin spot volume. A shaky mix. Who blinks first? Liquidations stayed small at $103.75K in 24 hours, with shorts losing $61.40K and longs $42.34K.
Holder Data Snapshot
Etherscan lists 915,516 holders, per Etherscan holder data.
Whales, meaning very large wallets, number 4,344. That's 0.47% of holders, yet they control 90.85% of market cap, and the top 100 wallets hold 61.50%. Concentration like that can amplify moves, and the LINK wallet count trend tracks how the base has grown.
Chainlink News Today
Link: NYC on Oct 29
Chainlink posted five agenda questions for Link: NYC on Oct 29, 2026, per Chainlink's event post, from about 9 hours before Oct 14, 2026, 05:00 UTC. Topics include tokenized assets, agentic finance, and digital cash. Two weeks of runway for early positioning.
Can LINK Rally Continue?
Bullish Scenario
Reclaiming $13.204 and $13.506 on rising volume could open a LINK price target of $14.027 within seven days, helped by fresh buyers like the ETF inflows breakout seen earlier. Trading below $12.372 cancels the idea.
Base Scenario
A chop between $12.372 and $13.204 may hold for three to five days if volume stays low.
Bearish Scenario
Trading below $12.372 could expose $11.906 within a week. A reclaim of $13.204 would cancel that.
What Could Change the Outlook
Progress on CCIP, Chainlink's cross-chain messaging protocol, could lift adoption, per the CCIP vault adapters report. But rallies need volume behind them, and fading volume says that's missing.
LINK Price Forecast for October 2026
Bull Case
This LINK price forecast reaches $14.652 before Oct 31, about 13.1% higher, only if $13.506 breaks first.
Base Case
A range of $12.372 to $13.506 could hold most of the month, and the October 2026 price prediction adds the wider view.
Bear Case
A break under $12.372 could drag LINK toward $11.906, about 8.1% lower, before Link:NYC arrives.
Risks That Could Change the Chainlink Price Prediction
Speculative flows, tracked in meme coin market news, can pull money away from large altcoins. One heavy whale can reset the chart. And zero ETF flows can turn into outflows.
Final Takeaway
This Chainlink price prediction leans cautiously bearish while the price trades under $13.204. Holding $12.372 keeps the channel alive.
But a reclaim above $13.506 flips the setup, and the price prediction hub tracks what follows. Timing matters.
Disclaimer: This article is for educational market analysis only and isn't financial advice. Crypto assets are highly volatile, and readers should research independently before trading.
0
0


 Manage all your crypto, NFT and DeFi from one place
Securely connect the portfolio you’re using to start.


