
Bitcoin Faces $80,400 Support Test as October Performance Falls Behind Historical Trends

0
0

What to Know
- Bitcoin traded near $80,867, falling 3.2% below its October opening price and trailing historical average gains of 6.7% significantly.
- CryptoQuant analyst Andrew Kamsky highlighted contrasting October performances, including Bitcoin’s 2022 recovery, strong 2023 gains, and weaker 2018 returns.
- Bitcoin faces critical support near $80,400, with a confirmed breakdown potentially exposing lower price levels around $77,000 and $73,500.
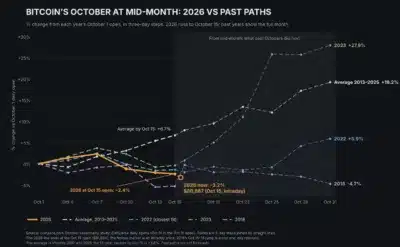
Bitcoin approached the $80,400 support level as October losses widened, falling below its opening price of $83,576. According to CryptoQuant analyst Andrew Kamsky, Bitcoin traded near $80,867 on October 15, marking a 3.2% decline against historical average gains of 6.7% and a median increase of 3.8%.
Bitcoin’s Previous October Results Show Different Recovery Patterns
Kamsky compared Bitcoin’s current weakness with October 2022, when prices peaked around October 5 before turning negative near October 8. Bitcoin subsequently traded within a narrow range until October 25, eventually finishing the month 5.9% above its opening price.
Also Read: XRP Death Cross Nears as $1.34 Support Faces Critical Test
October 2023 followed a different pattern, with stronger gains emerging during the second half and pushing Bitcoin 27.9% higher by October 31. In contrast, Bitcoin ended October 2018 with a 4.7% decline, demonstrating that historical seasonal trends do not guarantee positive returns.
Source: CryptoQuant
Rising Wedge Breakdown Places Lower Bitcoin Support Levels in View
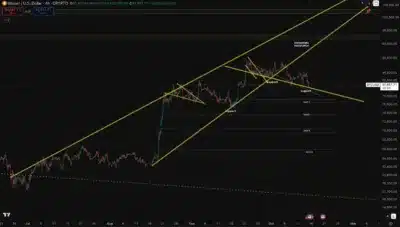
Beyond the historical comparison, Kamsky identified a breakdown below a rising wedge formation on Bitcoin’s four-hour chart. The pattern developed over three months, with prices testing both boundaries before breaking lower on October 7.
Source: CryptoQuant
Bitcoin subsequently approached trendline support near $80,400, close to the October 8 low, making that area significant. A sustained hold above this level could allow Bitcoin to revisit former wedge support, which now represents short-term resistance.
Alternatively, a confirmed four-hour close below the trendline would weaken the rebound scenario and expose consolidation zones. Kamsky identified $77,000 and $73,500 as potential support areas, followed by deeper levels around $70,000 and $64,000. Bitcoin’s response near $80,400 will determine whether the current decline stabilizes or extends toward those lower price levels.
Also Read: XRP Rebounds 5% as Binance Traders Record $184 Million in Buying Activity
The post Bitcoin Faces $80,400 Support Test as October Performance Falls Behind Historical Trends appeared first on 36Crypto.
0
0

 Manage all your crypto, NFT and DeFi from one place
Securely connect the portfolio you’re using to start.
 Where will Bitcoin trade next?
Live Polymarket and Kalshi odds on Bitcoin price targets, compared side by side.
See Bitcoin price odds


