
Aptos price prediction for 2026 – 2032: Will APT token hold bullish hopes?

0
0

Key takeaways:
- Our Aptos price prediction anticipates a high of $1.54 by the end of 2026.
- In 2028, it will range between $3.33 and $6.91, with an average price of $5.18.
- In 2030, it will range between $7.15 and $9.98, with an average price of $8.20.
Our Aptos price prediction expects APT to reach a high of $1.54 by the end of 2026, exceed $9 in 2031, and potentially reach $10 by 2032, with an average price of $10.95 in 2032.
The Aptos blockchain has aggressively attracted capital to its ecosystem, with total value locked (TVL) exceeding $35 million, while Aptos remains a high-performance layer-1 blockchain with a mature decentralized finance (DeFi) ecosystem.
For crypto investors, traders, and enthusiasts weighing Aptos’s investment potential, this forecast breaks down Aptos’s price history, technical analysis, market sentiment, trading volume, and short- and long-term price predictions from 2026 to 2032 so you can judge where the token may fit in an evolving crypto market.
Aptos Network continues to build decentralized applications and tools for developers, and tracking APT’s outlook helps readers assess risk, spot market trends, and make better-informed investment decisions.
Overview
| Cryptocurrency | Aptos |
| Symbol | APT |
| Current price | $0.46 |
| Market cap | $406M |
| Rank # | 89 |
| Circulating supply | Approx. 889M APT (current circulating supply) |
| Max supply | 2.1B |
| Trading volume (24h) | $32M |
| 24-hour high | $0.4678 |
| 24-hour low | $0.4334 |
| All-time high | $19.90 on Jan 30, 2023 |
| All-time low | $0.5129 on Aug 31, 2026 |
Aptos price prediction: Technical analysis
| Metric | Value |
| Volatility (30-day variation) | 13.80% (Very High) |
| 50-day SMA | $0.7237 |
| 200-day SMA | $0.7094 |
| Current APT sentiment | Bearish |
| Green days | 8/30 (27%) |
| Fear and Greed Index | 10 (Extreme Fear) |
Aptos price analysis
At press time, Nov 16, Aptos traded at $0.70, down 3.59% over the past 24 hours, 18% over the past week, and 12.82% over the past 30 days based on recent market data for the asset. Its trading volume surged 22% over the last 24 hours, showing stronger near-term conviction in the price trend.
Aptos 1-day chart price
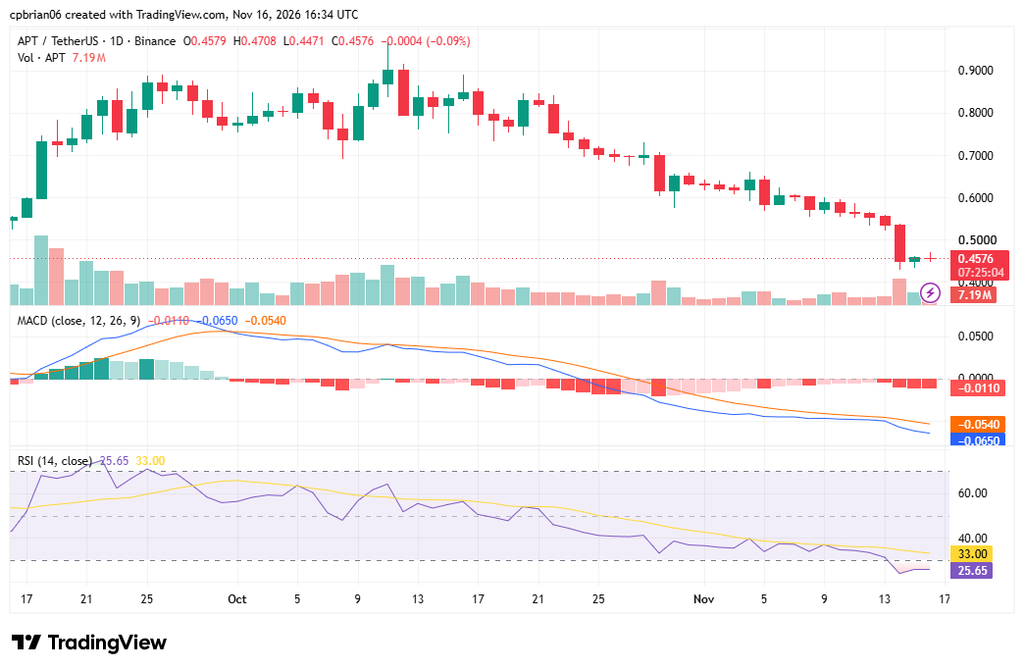
The MACD histograms show that APT’s negative momentum is rising. The move came after APT faced resistance at $0.82. The latest candle formation, three black crows, suggests a bearish continuation.
Its relative strength index (RSI) is oversold (25.65). RSI is an oscillator, a technical analysis tool that constructs upper and lower bands based on two extreme values (30 and 70). It is overbought above 70 and oversold below 30.
Aptos 4-hour chart price analysis
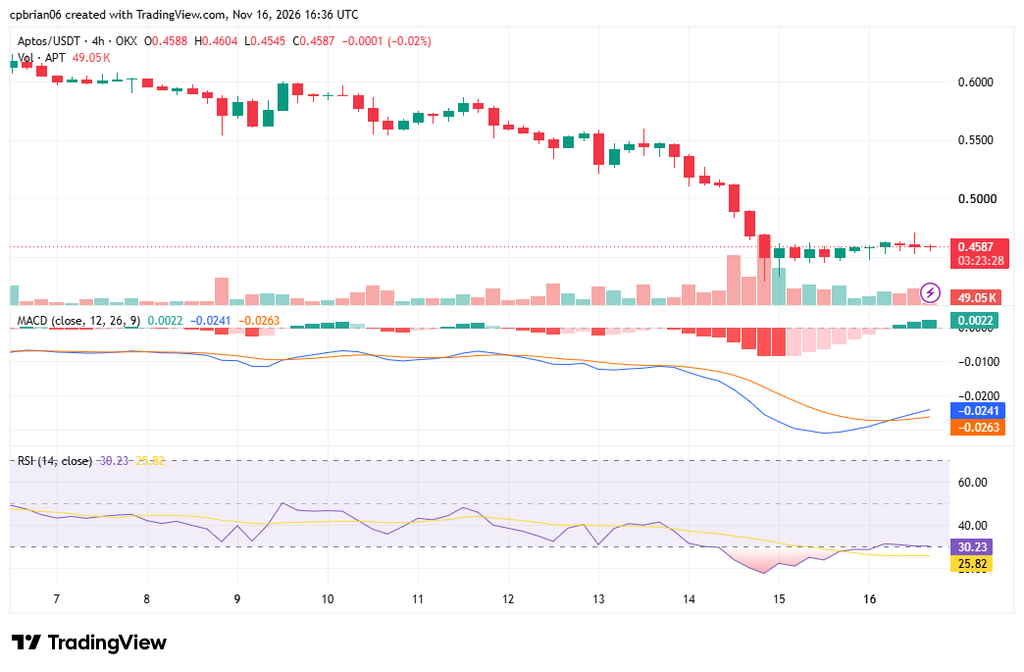
The chart highlights APT’s run this month. The trend was generally bearish. Over the last few days ,it has been moving sideways after registering a new ATL at $0.43. Its momentum is positive, with support and resistance levels at $0.43 and $0.59, respectively.
Aptos technical indicators and market cap: Levels and actions
Daily simple moving average (SMA)
| Period | Value ($) | Action |
| SMA 3 | 0.5130 | SELL |
| SMA 5 | 0.5334 | SELL |
| SMA 10 | 0.5613 | SELL |
| SMA 21 | 0.6110 | SELL |
| SMA 50 | 0.7237 | SELL |
| SMA 100 | 0.6684 | SELL |
| SMA 200 | 0.7094 | SELL |
Moving averages are a technical analysis tool used to identify trends and potential support or resistance levels. APT is trading below its 50-day and 200-day Simple Moving Averages, so those levels act as resistance.
Daily exponential moving average (EMA)
| Period | Value ($) | Action |
| EMA 3 | 0.4991 | SELL |
| EMA 5 | 0.5219 | SELL |
| EMA 10 | 0.5558 | SELL |
| EMA 21 | 0.6075 | SELL |
| EMA 50 | 0.6642 | SELL |
| EMA 100 | 0.6861 | SELL |
| EMA 200 | 0.8480 | SELL |
What to expect from the APT price analysis next?
According to the technical indicators, APT’s near-term price action remains weak, reflecting bearish sentiment around the asset. In the short term, the prediction suggests a bearish run. There is support at $0.43; if broken, it could send APT to $0.35.
Why is Aptos down?
Aptos is caught in a market-wide downdraft, underperforming amid a cautious environment due to its risk-on profile. Key watch: Whether APT can defend the $0.70 support level in the next 24 hours, as a break could trigger another leg down, especially during broad risk-off periods when market share shifts among layer-1 networks and competition from rivals can weigh on sentiment.
Will Aptos reach $10?
Yes, Aptos will rise above $10 in 2031. The move will come as the market corrects to previous highs.
Will Aptos reach $100?
According to Cryptopolitan’s price prediction, it remains unlikely that Aptos will reach $100 before 2032.
Will Aptos reach $1,000?
According to Cryptopolitan’s price prediction, it remains unlikely that Aptos will reach $1,000 before 2032.
What is the long-term price prediction for Aptos?
According to Cryptopolitan price predictions, Aptos will trade higher in the years to come, though the long-term case also depends on developer confidence, which high throughput and low latency can support as the network scales against other blockchain platforms. However, factors such as market crashes or stringent regulations could undermine this bullish thesis, even though strong technology and scalability support the long-term case, and changes to tokenomics can materially alter net supply growth and token demand. Scaling beyond 100,000 transactions per second would also shape the long-term impact, while investment still carries risk from intense competition from other layer-1 blockchain platforms if superior Layer 1 or Layer 2 solutions weaken Aptos’s market position.
How high can Aptos coin go?
According to Cryptopolitan’s price prediction, Aptos will reach a high of $10 in 2031.
Recent news: Aptos Foundation locks 210M APT
The Aptos Foundation has permanently locked and staked 210 million APT coins, removing the tokens from any future sale or distribution. This reduces the Foundation’s holdings, but the tokens will continue to exist and generate rewards, so it is not a burn either. Aptos also employs both programmatic and manual token burns, and those are separate from this Foundation lockup rather than combined with it.
Aptos price prediction November 2026
The Aptos price forecast for November ranges from $0.49 to $0.75. The average price for the month will be $0.52.
| Month | Potential low ($) | Potential average ($) | Potential high ($) |
| November | 0.40 | 0.52 | 0.75 |
Aptos price prediction 2026
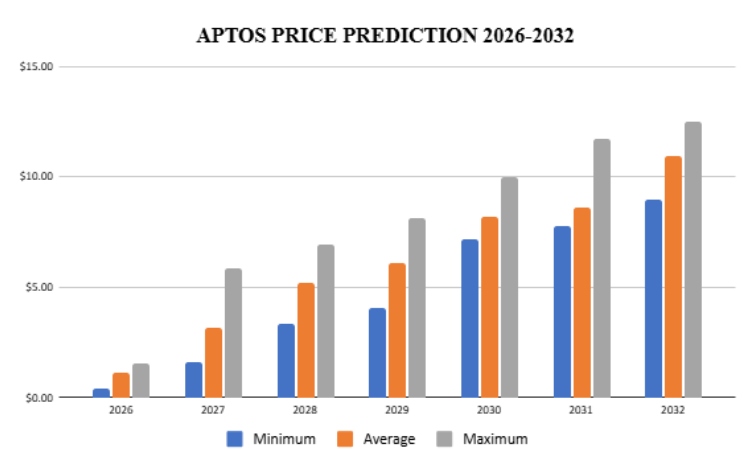
For 2026, APT’s price will range between $0.55 and $1.54. The average price for the period will be $1.10.
| Year | Potential low ($) | Potential average ($) | Potential high ($) |
| 2026 | 0.40 | 1.1 | 1.54 |
APT price prediction 2027–2032
| Year | Potential low ($) | Potential average ($) | Potential high ($) |
| 2027 | 1.59 | 3.18 | 5.84 |
| 2028 | 3.33 | $5.18 | $6.91 |
| 2029 | 4.08 | $6.10 | $8.10 |
| 2030 | 7.15 | 8.2 | $9.98 |
| 2031 | 7.78 | 8.59 | $11.69 |
| 2032 | $8.98 | $10.95 | $12.50 |
Aptos price prediction 2027
The Aptos APT price prediction estimates a range of $1.59 to $5.84, with an average price of $3.18. Other forecasts place 2027 in a much lower range of $0.6472 to $0.9467, with 2.42% upside at the upper target. Many platforms also place Aptos’s price forecast in a $10 to $30 trading range over the next two years.
Aptos price prediction 2028
Aptos coin price prediction climbs even higher into 2028. In a base case, APT’s trading price is expected to range from $3.33 to $6.91, while a more optimistic bull case could push it toward a higher peak ahead if momentum can confirm the trend; by contrast, bearish market expectations can keep 2027 targets in a much lower range, with an average of $0.89.
Aptos price prediction 2029
Our analysis indicates a further acceleration in APT’s price. It will trade between $4.08 and $8.10, with an average price of $6.10.
Aptos price prediction 2030
According to the Aptos forecast for 2030, the APT price is projected to range from $7.15 to $9.98, with an average of $8.20.
APT price prediction 2031
According to the Aptos price prediction for 2031, the price is expected to range between $7.78 and $11.69, with an average of $8.59.
Aptos price prediction 2032
The Aptos price prediction for 2032 is $10.95. It will reach a minimum price of $8.984. For readers asking how much Aptos will be worth farther out, some longer-range models predicted it could reach $12.15 by 2041.
APT market price prediction: Analysts’ APT price forecast
| Platform | 2026 | 2027 | 2028 |
| Coincodex | 0.3994 | 0.3007 | 0.2112 |
| Gate.com | 0.4572 | 0.5600 | 0.6216 |
Cryptopolitan’s APT price prediction
Our predictions indicate that APT will reach a high of $1.54 by the end of 2026. In 2028, it will range between $3.33 and $6.91, with an average of $8.59. In 2031, it will range between $7.78 and $11.69, with an average price of $8.59.
Aptos price predictions are influenced by technological advancements, market sentiment, and institutional adoption. Future appreciation also depends on Total Value Locked, dApp ecosystem maturity, and how network activity on the Aptos platform can generate demand for transaction fees and the native token’s utility.
Note that the content provided and other content are for general information purposes only and are not investment advice; they should not be treated as financial, fiscal advice, or other advice before making any investment decision. Seek independent professional consultation or do your own research before investing.
To stay informed, follow Aptos news and market conditions.
Aptos historic price sentiment
- Aptos raised seed funding in January 2022, led by a16z; the project was co-founded by Mo Shaikh and Avery Ching, and early backers also included FTX Ventures. Series A funding included Apollo, Dragonfly, Franklin Templeton, and others.
- Aptos traces its origins to the Diem project, which formed the foundation for the network’s early architecture and team.
- After launch, Aptos Labs and the Aptos Foundation became the core organizations supporting ecosystem development and broader Aptos work.
- The Aptos blockchain launched its mainnet on October 12, 2022, at Aptos genesis, with an initial supply of 1 billion tokens, of which only 13% was allocated to investors. It uses a Byzantine Fault Tolerance consensus algorithm for network security.
- Its yearly inflation rate starts at 7% and declines toward 3.5% over time.
- Aptos uses the Move programming language for smart contracts and a parallel execution engine to support decentralized applications, with potential use cases including gaming and other ecosystem expansion examples tied to broader smart-contract activity.
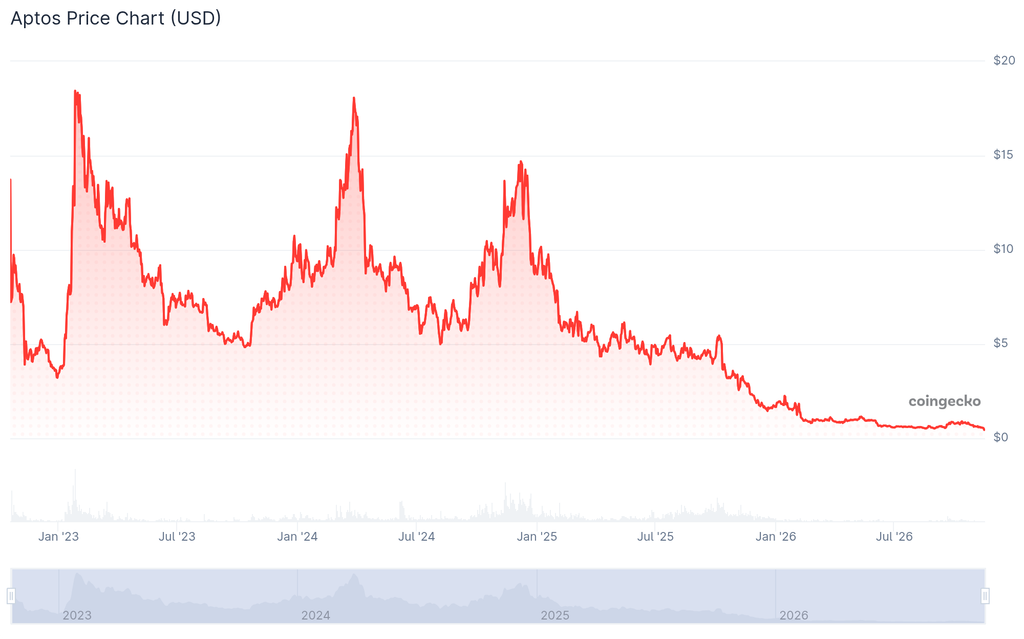
- After the launch hype, APT fell to its lowest in December 2022, at $3.09. A month later, the tables turned, as it peaked at $19.90 on January 30, 2023.
- It pumped, partly driven by the NFT market. Collections such as Aptos Monkeys and Aptomingod have attracted more users.
- On June 6, it fell below its initial listing price, extending losses from the preceding months.
- In October, it began correcting, rising to $8.47 in November.
- In 2024, it broke above $10, reaching $18 in March. From April, it reversed and fell below $10. By September, it had fallen to $6. It recovered in October, rising above $7.50. It crossed into November, trading at $8.9, and rose to $13.91. It corrected and traded at $13.24 into December.
- It was later corrected and crossed into 2025, trading at $8.71. The drop continued into February, and in May, it fell below $5.10.
- In October, it crossed above $5.30, then assumed a bear run, and by November, it had dropped to $3.21. In December, it reached a support level of $1.70. It maintained the levels into January 2026.
- Later, it turned bearish, falling below $1 in March and $0.90 in April. In May, it rose back above $1.00. In June, it had dropped to $0.65.
- The trend changed in September, as APT broke out to the upside and peaked at $0.88 in October. Afterward, it entered a steep bear run, and by November, it had fallen to $0.45.
0
0

 Manage all your crypto, NFT and DeFi from one place
Securely connect the portfolio you’re using to start.


