
Ethereum Outlook. Will Price Recovery Start in November?

0
0

Ethereum is down almost 2% on Thursday but is edging closer to recovering some of its losses. The 1-day chart shows that it has erased the gains recorded over the last two days.
However, the 4-hour chart shows that the latest decline began during the previous intraday session. The selling pressure intensified in the session that started at 00:00 UTC, and the asset has since recorded only muted upward momentum.
Interestingly, Ethereum ended Wednesday with little change in value despite reaching a five-day high. The reason is not far-fetched: the Federal Open Market Committee (FOMC) announced its interest rate decision. US policymakers voted to leave interest rates unchanged. A previous analysis noted that such a decision could result in a slight decline, which played out after the FOMC made its announcement.
Another anticipated release was the latest PCE inflation data and weekly jobless claims. The figures largely came in as expected. For example, the PCE price index rose 0.5% month over month, as expected, while core PCE inflation stood at 3.1% year over year.
Although the figures were in line with forecasts, they have not eliminated concerns about inflation. The latest reports suggest that price pressures remain elevated in the US. At the time of writing, the market has yet to show a strong reaction, leaving it uncertain whether investors have fully priced in the latest releases.
Away from fundamentals, traders lost $330 million in the perpetual futures market over the last 24 hours. Ethereum accounted for $88 million in liquidations, the highest amount across the crypto market. Long positions made up around 51% of the liquidated funds.
Although prices appear relatively stable at the time of writing, October has been marked by substantial declines.
Ethereum Down 13% This October
Ethereum is trading at $2,340 and has formed a doji candle on the 1-week chart. Although it remains in positive territory on this timeframe, there is growing uncertainty about its next price move.
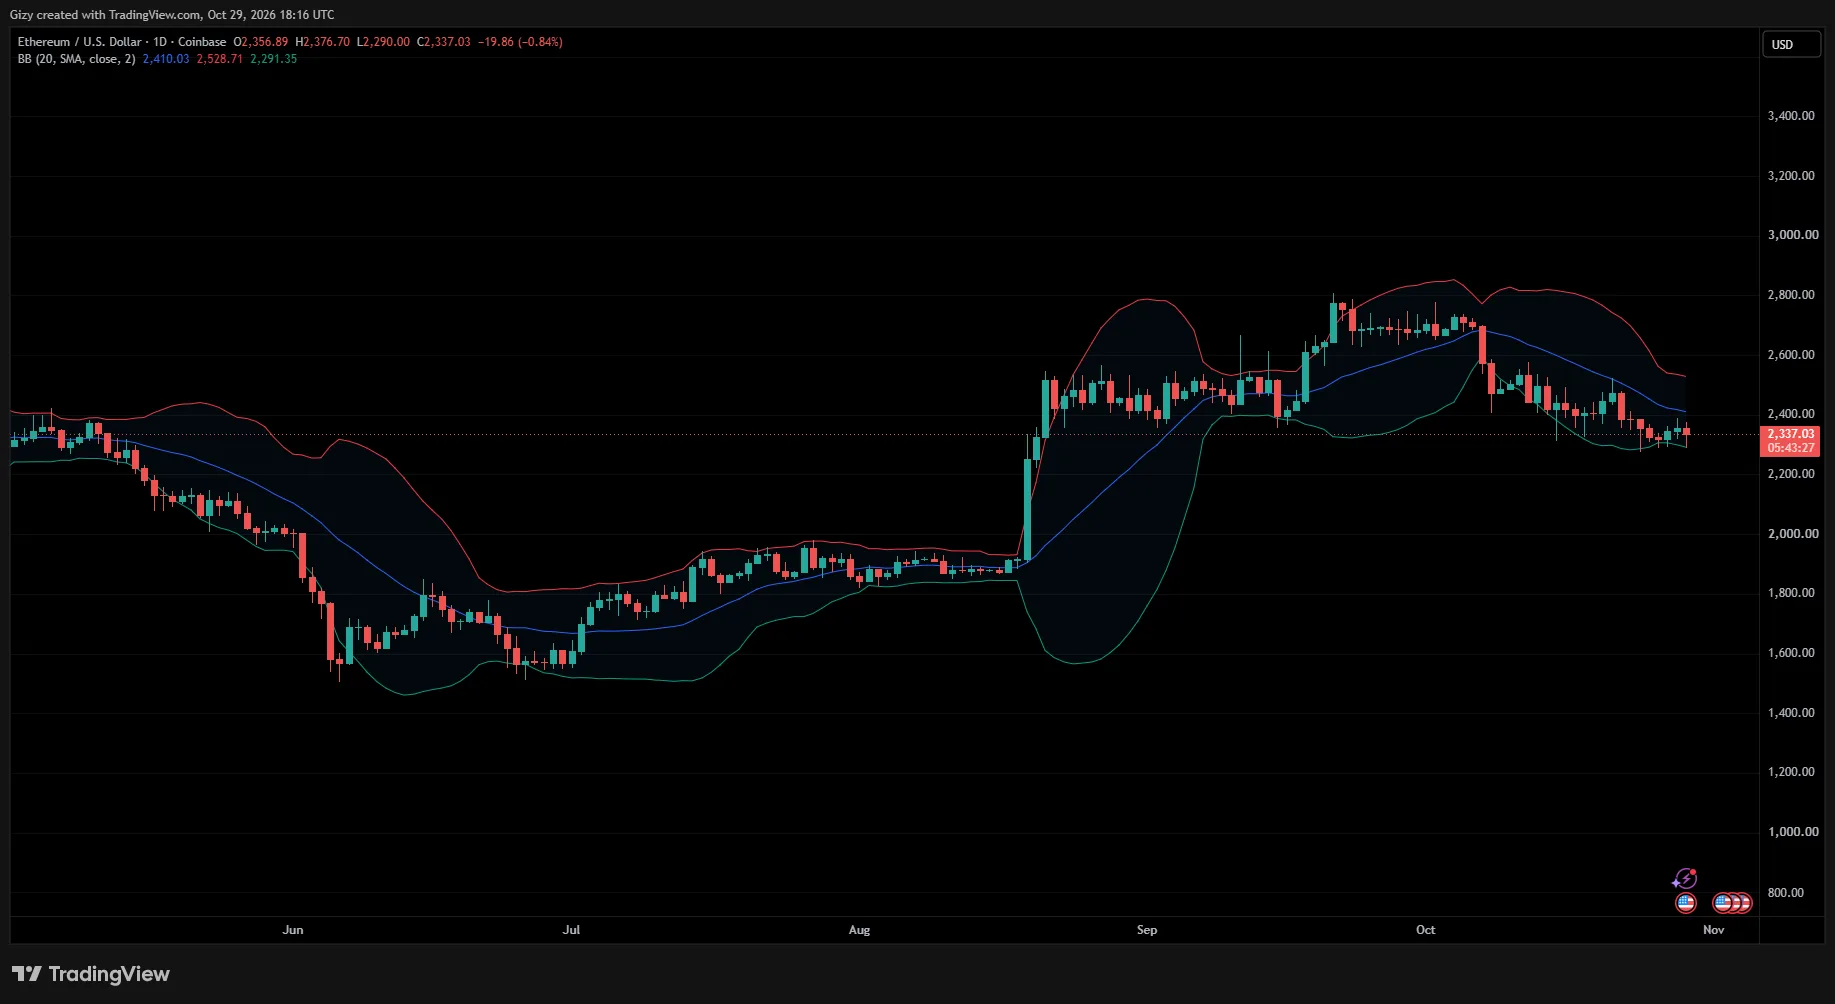
In hindsight, investors entered October expecting a significant uptrend. The Fear and Greed Index stood at 70, reflecting notable greed. The first major setback came on October 7, when the asset retraced almost 5% after several days of relatively small pullbacks.
Another 4% decline followed shortly afterward, paving the way for the gradual sell-off that has continued over the last two weeks. On the 1-week chart, the altcoin has recorded declines for three consecutive weeks. Based on its current price, ETH is down more than 13% this month.
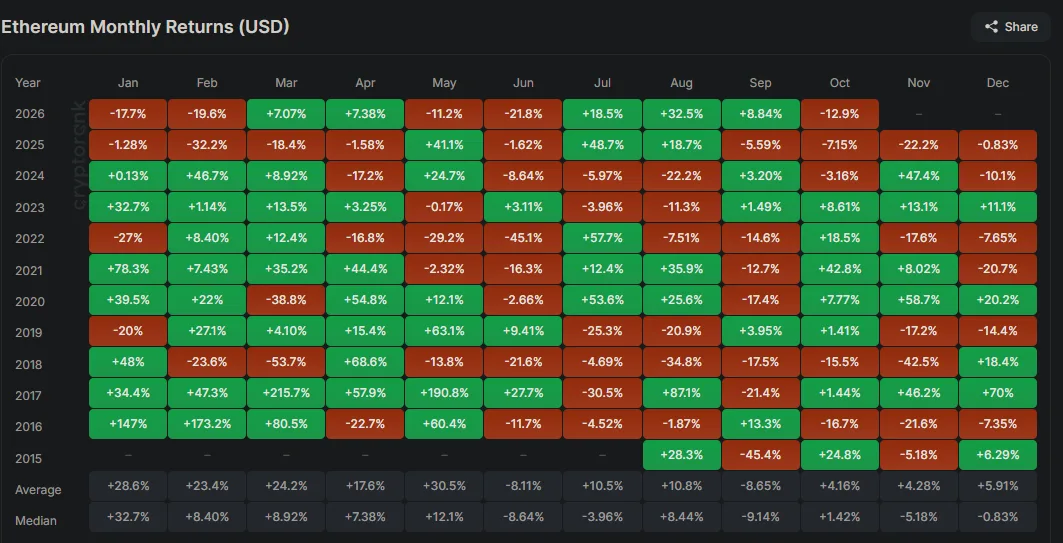
A bearish close to the current 30-day session would not be surprising, as a previous outlook predicted this outcome. One of the reasons cited was growing buying exhaustion. The analysis noted that July closed with gains exceeding 18% and August ended with gains exceeding 32%, while September recorded a smaller gain of 9%.
The second reason was ETH’s previous price action, which suggested that the conditions for another downward move were already becoming visible.
Several factors have contributed to Ethereum’s decline over the last 28 days. Among the most prominent are macroeconomic developments and other news events that have weighed on market sentiment. These factors have contributed to the broader bearish mood across the crypto market, also affecting demand for exchange-traded funds (ETFs).
US spot Ethereum ETFs have recorded significant outflows over the last 28 days. They could end the month with negative netflows exceeding $1.35 billion, potentially marking their largest monthly outflow since November 2025. Looking more closely, the week beginning October 9 recorded the largest outflow, ending with a netflow of -$500 million.
Following the massive sell-off, however, ETF outflows have progressively declined. This week, the netflow stands at -$170 million. It remains to be seen whether the first week of November will break the five-week streak of negative netflows.
A Bearish Start to Q4
The fourth quarter is off to a difficult start.A significant downtrend during the first month of the quarter may not have a huge impact on the overall performance, or will it?
Source: CryptoRank
The monthly heatmap reveals a historical pattern worth examining. The last time Q4 began with a notable decline, further decline followed. The most recent example was in 2025, although the subsequent price action needs to be considered in the context of the bear market that was beginning to take hold.
Current conditions are different, making 2024 another useful point of comparison. That year, Ethereum recorded a positive September followed by a negative October. November also ended in positive territory, but December closed red.
In 2016, September also ended with notable gains, but the rest of the fourth quarter was bearish. Other instances in which September and October both ended in negative territory may offer additional context for assessing the possibility of further weakness.
However, these historical examples do not establish a consistent pattern or guarantee a particular outcome. Instead, they highlight two possible scenarios for the remaining months of the quarter: November could recover before December turns lower, or the two months could produce the opposite outcome.
Overall, the historical evidence raises the possibility of further downtrends during Q4, but it is not conclusive. The key question is whether November will extend October’s losses or provide some relief.
What Will Ethereum Do?
Ethereum could perform better next month, and several factors suggest that selling pressure may ease. The first is the gradual reduction in spot ETF outflows. Over the last four weeks, negative netflows have progressively declined, suggesting that the pace of withdrawals may be slowing.
If ETF inflows improve significantly in November, prices could benefit. However, this remains speculative, as future ETF demand is difficult to predict.
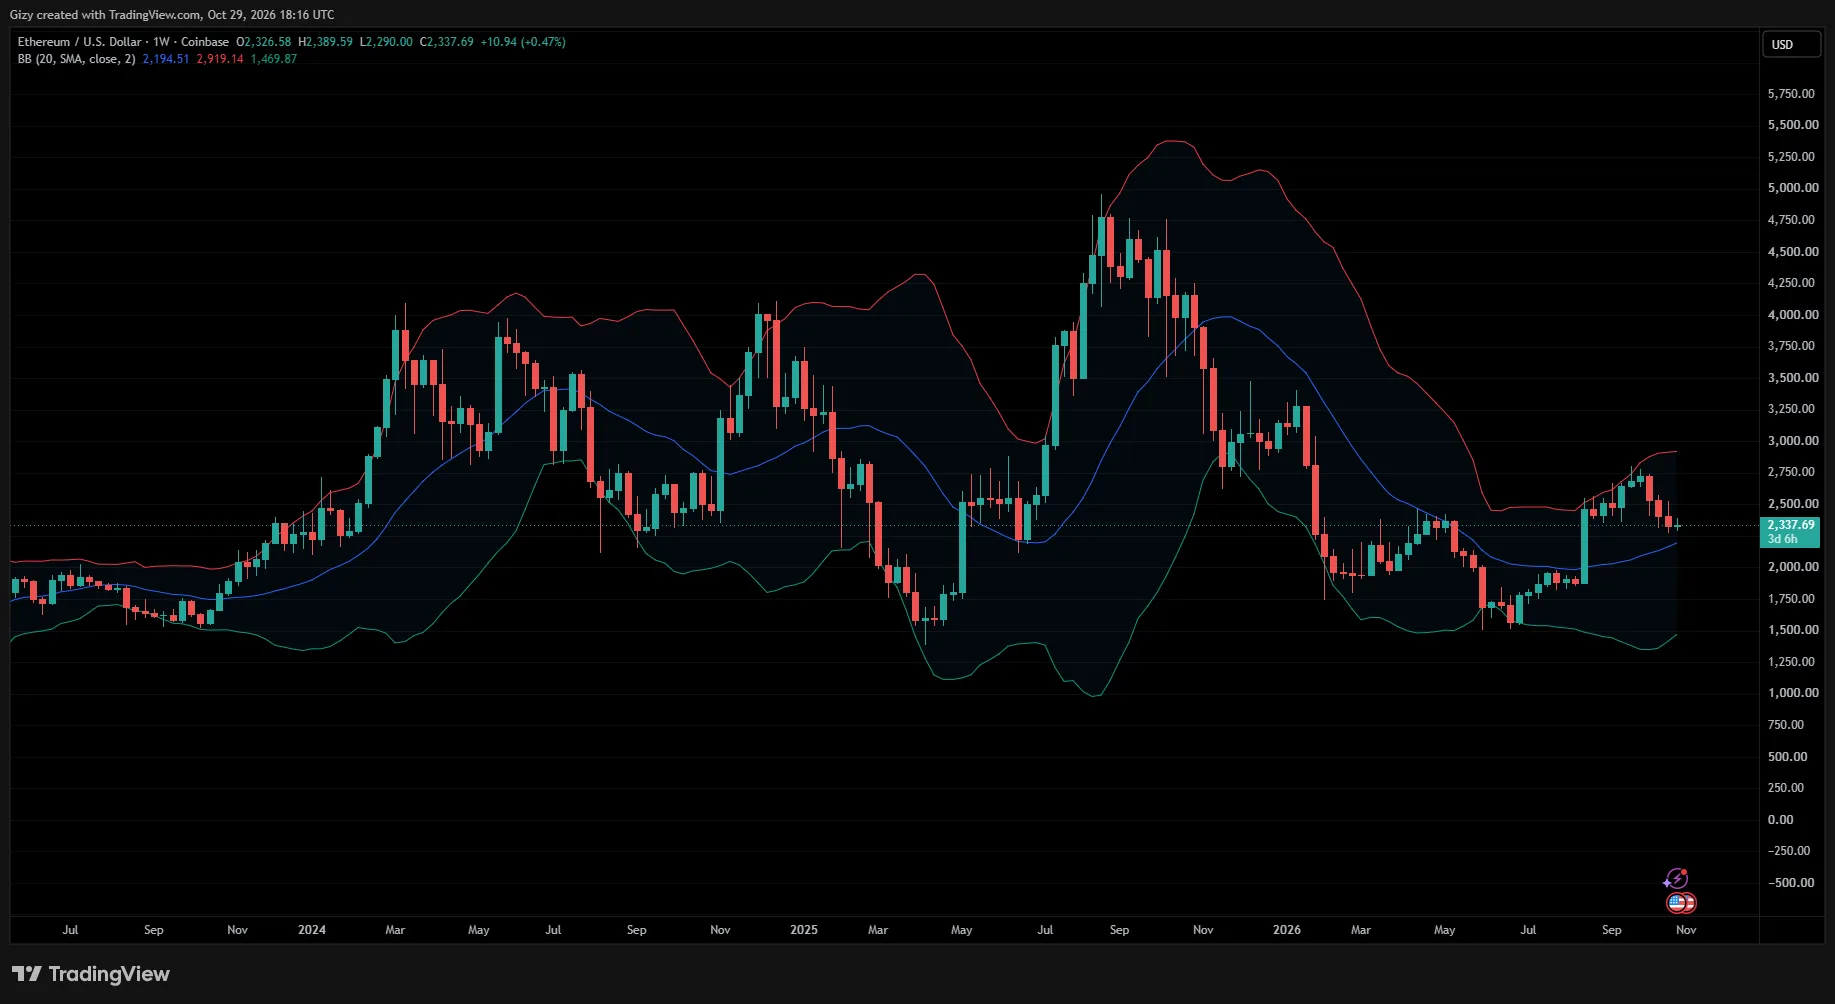
Another potential sign that selling pressure could ease is visible on the 1-week chart. Ethereum has been in a downtrend for three consecutive weeks, and it remains to be seen whether the current week will also end in negative territory.
Looking at price action over the last two years, periods of significant declines lasting three or four weeks have sometimes been followed by consolidation or modest rallies. If this trend holds, November could see reduced selling pressure.
The possibility of a recovery also deserves attention because Ethereum is trading near the middle Bollinger Band. This level can act as a dynamic support or resistance zone, while the relevant simple moving average (SMA) may also provide support. If ETH holds these levels and buying pressure improves, a rebound could develop over the coming weeks. However, a sustained move lower would weaken this recovery scenario.
The post Ethereum Outlook. Will Price Recovery Start in November? appeared first on CoinTab News.
0
0

 Manage all your crypto, NFT and DeFi from one place
Securely connect the portfolio you’re using to start.
 Where will Ethereum trade next?
Live Polymarket and Kalshi odds on Ethereum price targets, compared side by side.
See Ethereum price odds


