
Solana heads into its first losing month since July at 100 dollars

0
0

Solana is quoted at $100.29 on Thursday evening. That puts the price 15.8 percent below the September close of $119.09, and October becomes the first month since July to end with a loss. After two strong summer months the direction is turning again, and the monthly close on Saturday evening falls right on the round hundred mark.
On the record: the monthly closing price was 36.6 percent up in August and 17.1 percent up in September, October stands at 15.8 percent down, and today's low was $99.23. Our assessment follows further below: the hundred mark is no support in itself, it becomes one only through the monthly candle that records it.
Where the price can point over a horizon of months is set out in our Solana price prediction. This article takes on the short stretch to the turn of the month: which levels hold, what the monthly close actually does, and what you as an investor in Germany can still check before November 1.
Where Solana stands before the monthly close
The price has moved in a narrow range for six days. Between October 24 and October 29 all daily closes lay between $100.34 and $102.74, a gap of 2.4 percent from the lowest to the highest value. In the 24 hours to Thursday evening the range ran from $99.23 to $103.65, with the price losing 1.8 percent. Solana worth $2.93 billion changed hands in that period, as shown on the Solana price page at CoinGecko.
A range of 2.4 percent over six days is unusually little for Solana. Looking at October as a whole gives a different picture: the monthly high came on October 5 at $121.52, the lowest daily close on this Thursday at $100.34. Between them lie 17.4 percent. On 21 of the 30 October days Solana closed below $110, on 13 days below $105. The month turned down early, then, and looked for a floor there.
Why October is the first red monthly candle since July
Solana's monthly record for 2026 looks like this: January minus 5.9 percent, February minus 30.2 percent, March plus 0.5 percent, April plus 0.7 percent, May minus 0.4 percent, June minus 9.3 percent, July minus 0.7 percent, August plus 36.6 percent, September plus 17.1 percent. Then comes October at 15.8 percent down. Each figure is the monthly closing price against the previous month's close, based on CoinGecko's daily closes.
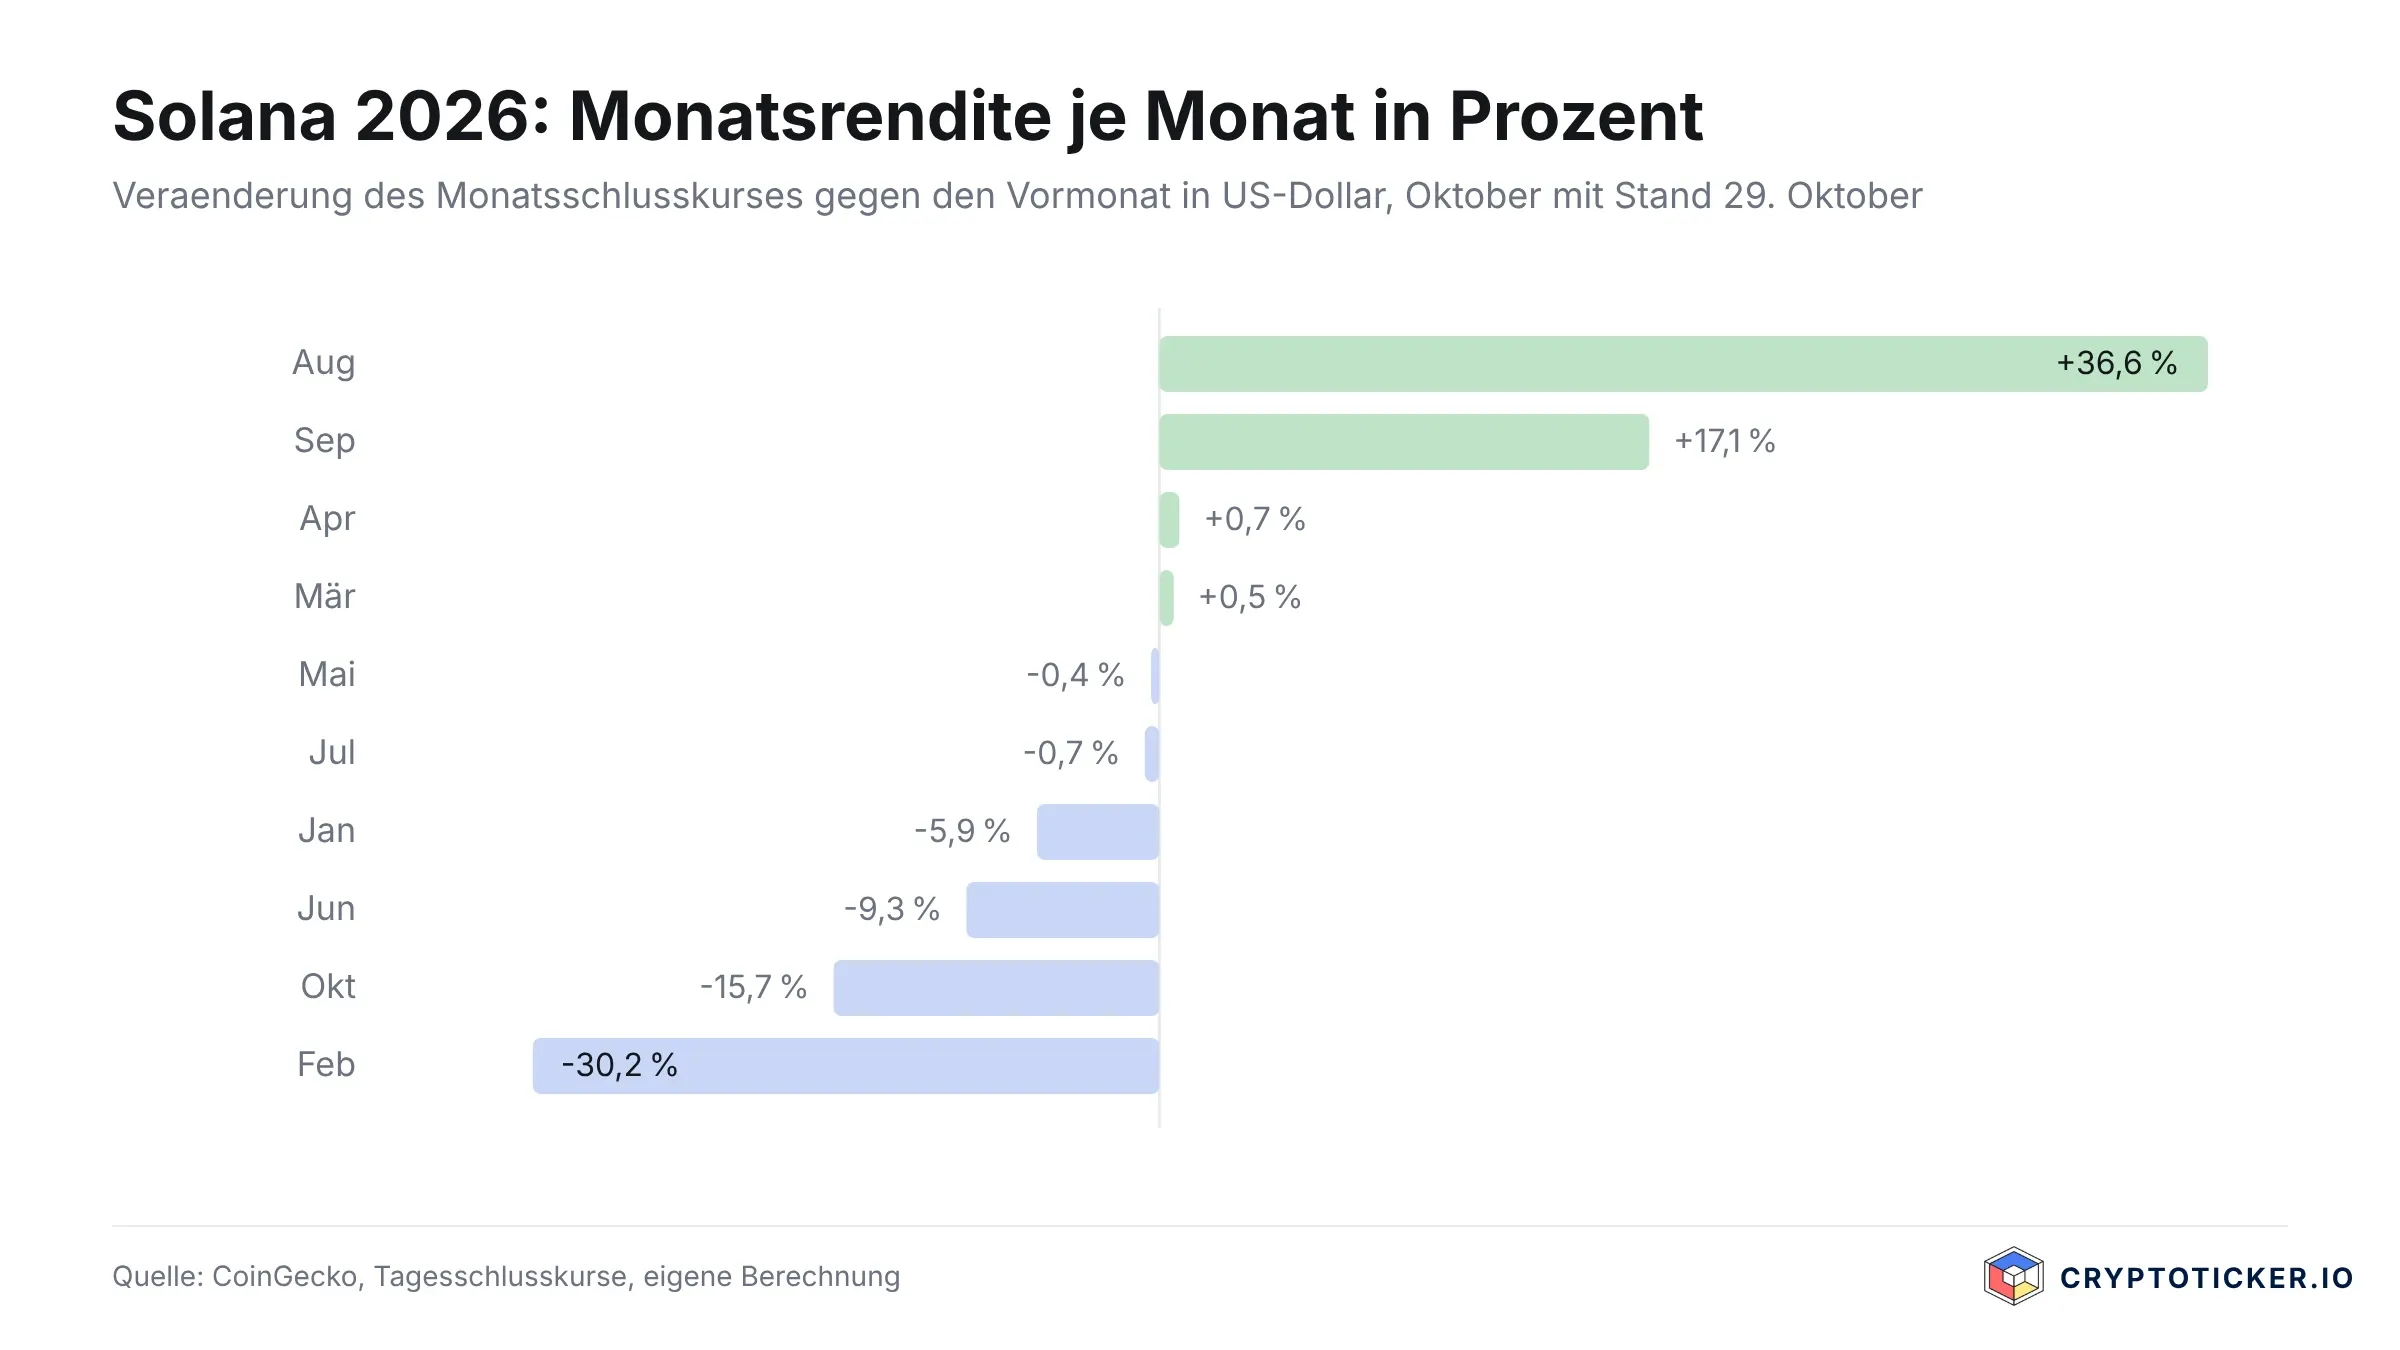
Two things stand out. First, July ended close to the zero line at 0.7 percent down, while October at 15.8 percent is the second-weakest month of the year after February. Second, October erases a good half of September's gain and almost a third of the August and September summer rally combined. Measured from the end of July at $74.46, a gain of 34.7 percent still remains.
91 cents gone since the last Solana forecast
On October 28 we wrote here about the decline in trading volume on Solana's decentralised exchanges. The price closed at $101.20 at the time. Today it stands at $100.29, which is 91 cents or 0.9 percent less. Within those 24 hours the price slipped below $100 twice and came back both times, most recently from the daily low at $99.23.
What is new is the date. Yesterday the monthly close was still two days away, today it is the next fixed point. And the level at issue yesterday was trading volume; today it is the price itself, because it sits on a round number.
The 100-dollar mark carries the monthly close
On the downside the next documented zone lies considerably lower. From February to May 2026 Solana closed four times in a row between $82.04 and $83.04, then at $75.01 and $74.46 in June and July. Between today's hundred mark and that zone around $82 there is a gap of roughly 18 percent without a monthly close. The 200-day average currently runs at $88.72 and therefore lies inside that gap.
On the upside the first hurdle is the 50-day average at $109.38. Above it follow the September close at $119.09 and the October high at $121.52. The fact that the price has traded below the 50-day average since October 23 explains the narrow range of recent days: above it the push is missing, below it the next hold is missing all the way to $88.72.
What the levels mean in concrete terms
A monthly close below $100 would be the first since July 2026. It would leave a red candle on the monthly chart whose body reaches from $119.09 to below $100. A close above turns the same candle into a shape with a long lower shadow, because the monthly low then lies below the closing price. Both shapes describe the same month but read differently on the chart.
Solana loses four times as much as Bitcoin in October
October was weak for the whole market, but not equally weak. Against the September close, Bitcoin is down 3.6 percent by Thursday evening, Ethereum 13.1 percent and Solana 15.8 percent. Solana therefore falls more than four times as sharply as Bitcoin and around a fifth more sharply than Ethereum. All three figures come from the same CoinGecko daily closes.
This pattern is nothing new for Solana. In August, when the market rose, Solana was well ahead of the two larger coins at 36.6 percent up. The leverage works in both directions, and that is exactly why the hundred mark is reached faster at Solana than a comparable round number at Bitcoin. Anyone betting on the monthly close with leveraged products should know that a daily range of 4.5 percent like today's already moves 22 percent of the capital committed at fivefold leverage.
How a monthly close acquires its weight
A monthly close is technically no more than the last price of a calendar month. It gains weight through three mechanisms that have nothing to do with chart analysis. First, exchange-traded products and funds settle their performance at month end, and that figure goes into reports and comparisons. Second, monthly options expire on the futures exchanges on the last Friday of the month, in this case October 30, which more often pulls trading that day towards round strike prices. Third, many trading systems use monthly candles as input; a close below a round level shifts their signals for the whole following month.
For private investors, that means the monthly close is not an event that moves the price but a point in time at which measurement happens. The movement comes from those who react to that measurement. The hours around the turn of the month are therefore often more restless than average, without any news behind it.
Capital in the network is shrinking faster than the price
Beneath the price lies the development on the Solana blockchain itself, and it is more pronounced. Capital locked in Solana applications stood at $6.46 billion on September 30 and at $5.67 billion on October 29, a decline of 12.2 percent. The figures are public at DefiLlama. Trading on Solana's decentralised exchanges came to $60.78 billion over the last 30 days and is therefore 35.7 percent below the same period a month earlier.
Against that stands a figure that holds: stablecoin capital on the Solana blockchain amounts to $15.18 billion. Stablecoins are tokens whose value is tied to a currency, usually the US dollar. This capital does not depend on a rising price and does not automatically leave the blockchain when prices fall. It is the second starting point alongside the chart: the money for trading stays, only the trading itself has fallen back.
Part of the supply is tied up in any case. Around three quarters of the circulating SOL was staked at the end of October, meaning deposited in the network to confirm blocks and earn a yield for doing so. Anyone wanting to use that can find the providers and their terms in the comparison of the best staking platforms. Staked SOL cannot be sold immediately, because release is tied to the epoch change; that dampens supply on weak days and delays it on strong ones.
How to check your Solana position before the turn of the month
Two points in Germany are tied to the date, not to the price. The first is the holding period. Anyone who has held Solana in their own possession for more than a year sells the gain tax-free under current law; anyone selling earlier pays their personal income tax rate on the gain, to the extent the annual exemption threshold of 1,000 euros is exceeded. What is politically in motion on that is tracked by our page on the status of the holding period reform. The purchase date is decisive, and you will find it in your exchange's account statement, not on the chart.

The second point concerns staking. The yield from staked SOL is taxable in Germany as other income when it is received, at the price on the day of receipt. Anyone who received rewards in October should secure the amounts and daily prices now, while they are still listed individually in the app. Doing it retrospectively is considerably more work.
There is also the question of where the coins are kept. If they sit at an exchange, release depends in case of doubt on that exchange's solvency; if they sit in your own wallet, it depends on how you keep your keys. Which providers are licensed in Germany under MiCA and what they charge per order is shown by the comparison of the best crypto exchanges. MiCA is the EU regulation that has set uniform licensing rules for crypto service providers in the European Union since 2024.
Our assessment of the monthly close
From the editorial team's point of view the hundred mark matters less than it currently looks. The numbers support that: between $100 and $88.72 there is no monthly close of the year, the 200-day average lies in the middle of that gap, and the narrow range of the last six days shows that neither buyers nor sellers are pressing at this level. A close at $99 or at $101 changes nothing material about that starting position.
Against it stands the third mechanism above: trading systems that read monthly candles do treat $99 and $101 very differently, and those systems trade in November too. Anyone acting short term has to factor that in. What we are not claiming: that a direction for November can be derived from it. The network figures point down, stablecoin capital holds, and both observations stand side by side. No recommendation to buy or sell follows from that.
Solana in November: below $100 the 82-dollar zone moves closer
October ends on Saturday at 23:59, and the price sits 29 cents above the round mark. Three steps that make sense before the turn of the month:
- Secure purchase data and staking rewards. Download the October statement from your provider while the individual items are available. Which tools calculate the holding period and the inflows automatically is shown by the comparison of crypto tax tools and portfolio trackers.
- Put your own levels in writing. $88.72 on the downside and $109.38 on the upside are the next documented points, not the round 100. Knowing in advance what you do at which level means not acting on feeling at the turn of the month.
- Calculate leveraged positions against the daily range. A 4.5 percent range on a quiet day is enough for a liquidation at high leverage. Anyone using perpetuals should know the funding costs and the liquidation threshold; the terms of the trading venues are in the comparison of the best perp DEXs.
(As of October 29, 2026. This article is not investment advice. Prices and fee structures change; check the terms with the provider before you buy.)
0
0

 Manage all your crypto, NFT and DeFi from one place
Securely connect the portfolio you’re using to start.


