
Ethereum Price Prediction: Can $2,328 Hold as ETFs Keep Selling?

0
0

Who's actually buying Ether while fund investors keep heading for the exit?
Weekly fund exits keep stacking up. Yet one giant buyer hasn't skipped a week for over a year.
That tug of war is shaping every Ethereum price prediction right now. And the chart has already picked a side.
Market Snapshot: Price, Volume and Market Cap
As of October 20, 2026, around 06:00 UTC, Ether trades near $2,392, down 1.53% in 24 hours, per CoinMarketCap data. Daily trading ranged from $2,372.89 to $2,443.56, while market cap stands at $292.19B.
Volume reached $8.5B, just 2.9% of market cap. Thin turnover for a coin 51.65% below its $4,953.73 peak.
Bitmine ETH Holdings: The Other Side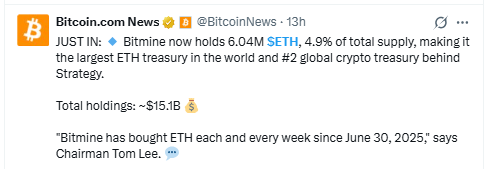
Bitcoin News reported that Bitmine ETH holdings reached 6.04M, or 4.9% of total supply. Total holdings sit near $15.1B. Chairman Tom Lee says buying hasn't paused once.
Treasury vs ETF: Who Holds More?
US spot funds hold $14.77B, or 5.04% of ETH market cap. Bitmine holds 4.9% of supply, with its latest holdings update listing 6.04M ETH.
So who wins the tug of war?
Daily outflow prints grab headlines first. Weekly treasury buys land quietly, and that gap may explain why price keeps stalling under the EMAs.
JPM Coin on Ethereum: Why Banks Matter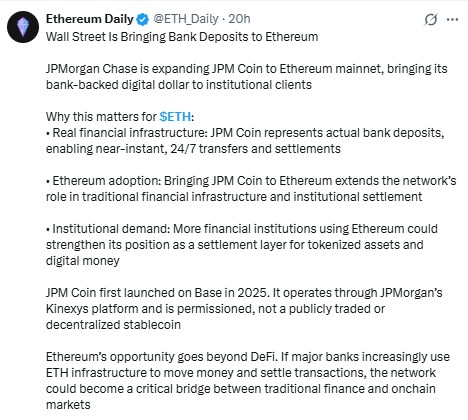
An Ethereum Daily post says JPMorgan Chase is expanding JPM Coin to the Ethereum mainnet. It first launched on base in 2025 and stays permissioned.
Settlement demand moves slowly. And price rarely reacts to slow stories on day one.
Binance-Peg ETH: Exchange Wallet Concentration
BscScan holder data shows the BNB Chain version of ether trading at $2,402.00, with two Binance-labeled wallets holding 16.75% and 14.11%. Concentration isn't bearish by itself. But it shows where liquidity sits.
Derivatives Snapshot: Futures Check
CoinGlass data puts open interest at $30.71B, with $35.04B in futures volume against $1.68B in spot.
ETH price today is driven by futures, which trade about 21 times spot activity. Binance accounts hold 2.94 longs per short.
Liquidations hit $42.23M over 24 hours, split between $22.55M longs and $19.67M shorts.
Return Window
Any Ethereum price forecast needs returns: down 8.59% over 30 days, up 24.77% over 90 days and down 18.91% year to date.
Bearish on the monthly slide, then. Actually, scratch that. A 24.77% three-month gain says buyers still show up on dips.
Ethereum ETF Outflows: Four Sessions in a Row
Outflows again. SoSoValue data shows $103.28M left US spot funds in the October 19, 2026 session. BlackRock's ETHA drove about $95.40M of it. Ethereum ETF outflows now total $362.69M across four sessions.
Cumulative inflows slid from $13.84B to $12.84B since early October. Net assets sit at $14.77B.
Ethereum Technical Analysis: Channel, EMAs and RSI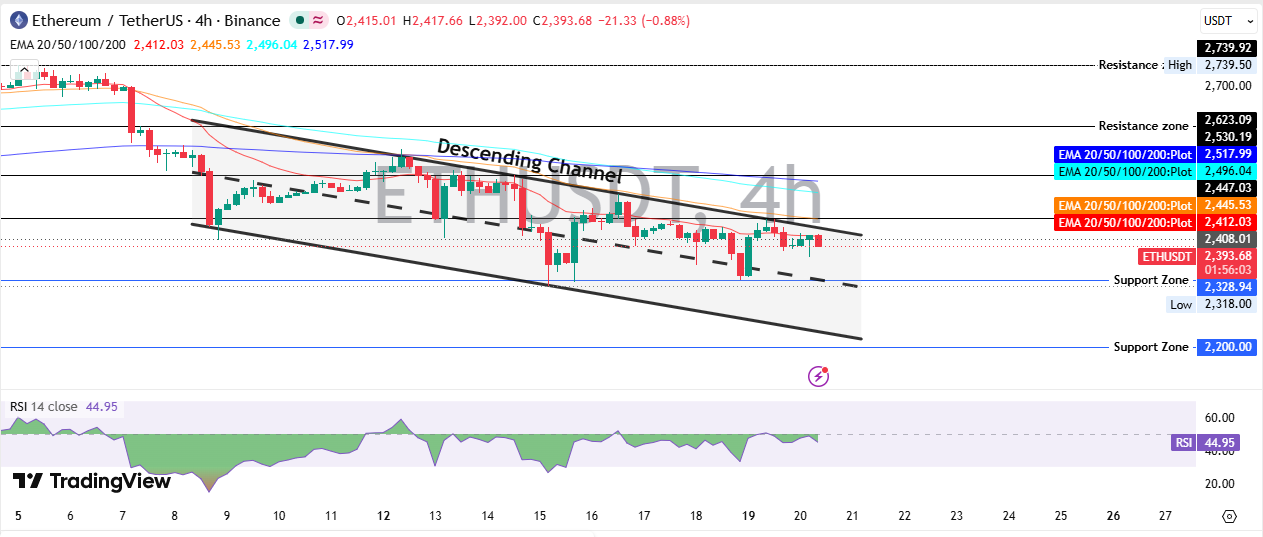
Ethereum technical analysis starts with the 4-hour ETH/USDT chart on Binance. Price keeps trading inside a descending channel, two falling trendlines boxing in every bounce. Lower highs, lower lows. And sellers still own the structure.
An EMA, or exponential moving average, weighs recent trading more heavily. Four sit overhead: 20 EMA at $2,412.03, 50 EMA at $2,445.53, 100 EMA at $2,496.04 and 200 EMA at $2,517.99. Every line sits above the price. And that's a ceiling, not a floor.
RSI reads 44.95, so sellers hold a slight edge. But oversold only begins below 30.
Ethereum Support and Resistance Levels
Support Zones
Ethereum support and resistance act like floors and ceilings, and the first floor sits at $2,328.94, with $2,200.00 below it.
Bears have one job left. Push through. For wider context, this key level breakdown covers BTC, ETH and XRP.
Resistance Zones
Overhead levels stack at $2,447.03, $2,530.19, $2,623.09 and $2,739.50. Bulls need one thing first. A trade above $2,447.03.
Ethereum Price Prediction: Scenario Table
This Ethereum price prediction maps three scenarios for the next seven days. Longer horizons sit on the yearly Ethereum forecast page.
Scenario | Trigger | Target | Invalidation | Liquidity |
Bull | Trades above $2,447.03 | $2,530.19, $2,623.09 | Below $2,328.94 | Fund inflows return |
Base | Range $2,328.94 to $2,447.03 | Chop inside range | Breakout either side | Outflows slow |
Bear | Trades below $2,328.94 | $2,200.00 | Above $2,447.03 | Outflows continue |
Bull Case
Can Ethereum reach $2,623? It could, if price breaks and holds above $2,447.03 with fund flows turning positive.
Base Case
Under the base case, price may chop between $2,328.94 and $2,447.03 while outflows slow.
Bear Case
Under the bearish case, a trade below $2,328.94 could open $2,200.00 if outflows keep stacking.
Last Call vs Actual Result
Target: the October 15, 2026 forecast flagged $2,350 as shaky and $2,200 as the next retest, per the earlier Ethereum liquidation analysis.
Actual: the chart low reached $2,318.00, so $2,350 broke, yet $2,200 never arrived. Status: Partially Hit. Timeframe: October 15 to 20, 2026, 06:00 UTC.
What Could Flip the Outlook
A trade above the 200 EMA at $2,517.99 would change the story. Rebound attempts, like the earlier buy signal setup, usually need funds back in positive territory first.
Long-Term Ethereum Outlook
Any long-range Ethereum price prediction needs a trend change first. The $4,953.73 record sits far above, and trading above $2,517.99 would be the first step.
Risks to the Forecast
Fresh outflows, forced selling in crowded longs and surprise headlines can reset the map. Tracking AI crypto news helps catch shifts early.
Final Takeaway
This Ethereum price prediction stays bearish while the price trades below $2,447.03 and the EMA stack. Funds sell, treasuries buy, and the channel decides. More forecasts sit in the crypto price prediction hub.
Disclaimer:This article is for information only and isn't financial advice. Crypto prices swing fast, and losses can happen. Scenarios, levels and targets are opinions, not promises. Readers should do independent research and consult a licensed financial advisor before investing.
0
0

 Manage all your crypto, NFT and DeFi from one place
Securely connect the portfolio you’re using to start.
 Where will Ethereum trade next?
Live Polymarket and Kalshi odds on Ethereum price targets, compared side by side.
See Ethereum price odds


