
Pepe Price Prediction: Can PEPE Reach $0.00000536 as Holders Top 600K?

0
0

The latest Pepe price prediction is rising after Etherscan data showed PEPE passing 600,000 holders on Ethereum.
The Pepe coin is up 6.9% over the last 24 hours, and traders want to know whether the rally can extend. PEPE now trades near $0.000005008.
Pepe launched in April 2023 as an Ethereum meme coin built on the Pepe the Frog meme.
According to CoinGecko, Pepe price today is $0.000005008, within a 24-hour range of $0.000004654 to $0.000005012. PEPE ranks 45th by market capitalization at about $2.106 billion.
Live Pepe Market Data
Metric | Value |
PEPE Price | $0.000005008 |
24h Change | +6.9% |
24h Range | $0.000004654 to $0.000005012 |
Market Cap | $2.106B |
Market Rank | #45 |
Source: CoinGecko, as of November 4, 2026.
Pepe News Today
Pepe news today centers on a holder milestone. According to BSCN, citing Etherscan, the $PEPE token on Ethereum now has exactly 600,013 holders.
The post says the count grew by nearly 5,000 over the past two weeks and adds that 700,000 is next.
Source: Data Taken From the @BSCNews X Account, as of November 4, 2026.
At that pace, 100,000 more holders would take roughly nine months. This is a simple calculation, not a forecast. Etherscan counts wallet addresses, not individual people, and covers Ethereum only.
CoinGape reported in June 2025 that $PEPE was nearing half a million holders, so the long-term trend is up.
A search found no separate confirmation of the 600,013 figure, so readers should treat it as unverified.
Pepe Technical Analysis
This Pepe price prediction for November 4 reads the daily PEPE/USDT chart on Binance.
Price trades above a rising trendline that has held since August. The line now runs near $0.0000043, and $PEPE has more than doubled from its summer low near $0.0000023.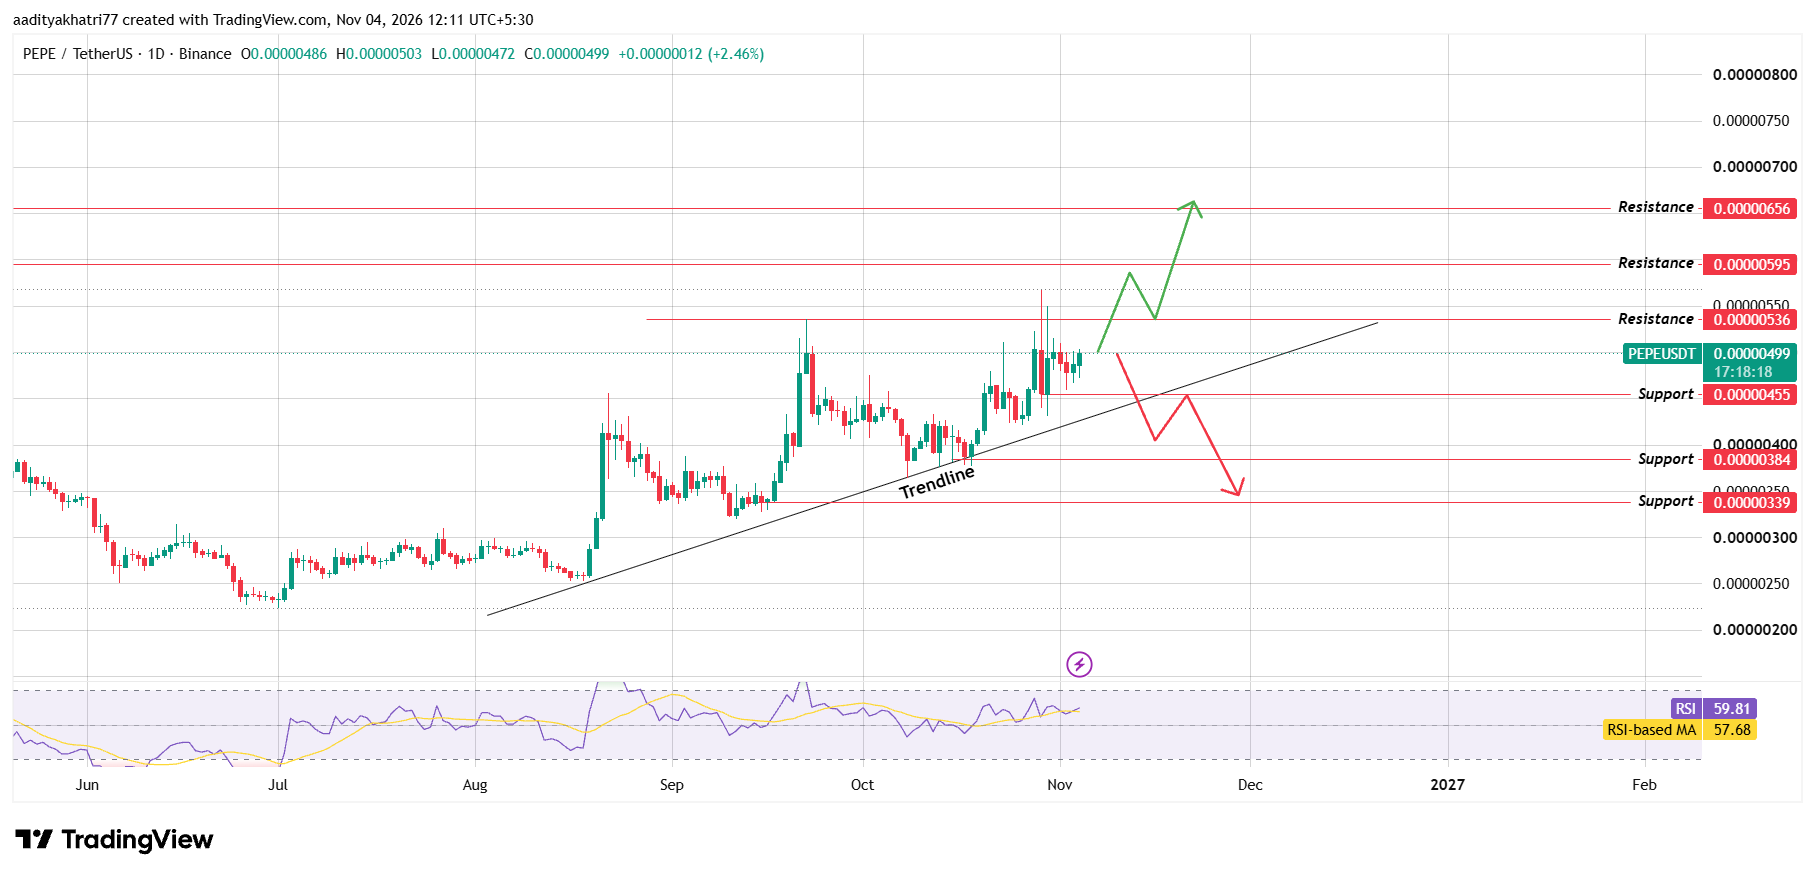
Source: TradingView, PEPE/USDT 1D, Binance, as of November 4, 2026.
Price sits well above the trendline, so the first test is resistance, not support. The September 22 high of $0.00000536 caps the price from above. An upper wick near $0.0000057 on October 29 was rejected.
The current candle opened at $0.00000486, ranged from $0.00000472 to $0.00000503 and traded near $0.00000499, a gain of 2.46%.
The RSI reads 59.81 against its average of 57.68, which shows mild bullish momentum below the 70 overbought line.
Can $PEPE Bounce and Break $0.00000536?
The bullish case starts with a hold. $PEPE needs to keep $0.00000455 intact, since it marks the base of the recent range and sits above the trendline.
The next step is a daily close above $0.00000536 with volume over the 20-day average.
The price stopped near $0.00000503 today, so a close on thin volume would carry little weight.
A confirmed break would open $0.00000595 first and then $0.00000656. The first of those sits above the October 29 spike high, so sellers may appear quickly.
What Happens If $PEPE Loses Support?
The bearish case begins with a rejection at $0.00000536. In that case, price would likely slide back toward $0.00000455, the first support.
A daily close below it on selling volume above the 20-day average would put the rising trendline in play, near $0.0000043. A close below both would open $0.00000384 and then $0.00000339.
A brief wick under the trendline is not enough. If the price closes back above it within a day or two, the move may prove a false break.
Price Levels to Watch
Support | Resistance |
$0.00000455 | $0.00000536 |
$0.00000384 | $0.00000595 |
$0.00000339 | $0.00000656 |
Bull, Base, and Bear Scenarios for Pepe Price Prediction
Scenario | Setup | Level |
Bull | $PEPE stays above $0.00000455, then a daily candle settles above $0.00000536 with volume over the 20-day average. | $0.00000595 first, then $0.00000656 |
Base | $PEPE keeps ranging between support and resistance, with no daily close beyond $0.00000455 or $0.00000536. | Between $0.00000455 and $0.00000536 |
Bear | Buyers lose $0.00000455, and a daily candle finishes under it and the rising trendline while selling volume tops the 20-day average. | $0.00000384 first, then $0.00000339 |
Pepe vs Bitcoin
Any Pepe price prediction outlook should check how PEPE trades against Bitcoin and Ether.
Over the last 24 hours, PEPE is up 6.9% in dollars, up 5.2% against Bitcoin and up 4.8% against Ether. Those figures imply that Bitcoin gained about 1.6% and Ether about 2.0% in dollar terms.
$PEPE therefore beat both. The move is partly market-wide and partly specific to the token.
Methodology
This Pepe price prediction draws on three inputs. Market data comes from CoinGecko and was taken on November 4, 2026.
The chart is a daily PEPE/USDT view from Binance in TradingView, with timestamps in UTC+5:30. The news item comes from a single BSCN post that cites Etherscan.
Support and resistance levels were read directly from the chart. The trendline carries no label, so the $0.0000043 reading is approximate.
CoinGecko uses a rolling 24-hour window, so its gain of 6.9% differs from the 2.46% shown on the daily candle.
The holder count was not independently confirmed. Trading volume, wallet data, and liquidation data were not part of this review, and the scenarios carry no assigned probabilities.
Expert Opinion
The post from BSCN highlights holder growth on Ethereum. As general market commentary, a holder count measures wallets and not demand. Growth of nearly 5,000 in two weeks is under 1% of the total.
The post gave no data on how many of these wallets are active. In the short term, the $0.00000455 level and the volume on any move toward $0.00000536 will show whether buyers keep control.
Disclaimer: This article is for information only and is not financial advice. PEPE is a highly volatile meme coin. Price can fall below $0.00000339 if support fails and broader market conditions weaken. No scenario here carries a stated probability, and a confirmed breakout can still reverse. Readers should do their own research and size any position to a loss they can accept.
0
0


 Manage all your crypto, NFT and DeFi from one place
Securely connect the portfolio you’re using to start.
 Where will Ethereum trade next?
Live Polymarket and Kalshi odds on Ethereum price targets, compared side by side.
See Ethereum price odds


