
Cardano Price Prediction: Can ADA Clear $0.1999 and Hit $0.2087?

0
0
Is the ADA done bleeding, or is this just a breather before another leg down?
Buyers lifted ADA to $0.1991 on Nov 5, 2026 at 09:54 UTC, and this Cardano price prediction leans bullish while the ADA price holds above $0.1962. Sellers ran the tape for weeks, yet a $0.1827 support rebound changed the mood.
Cardano Data Snapshot: What the Numbers Say Today
CoinMarketCap data puts ADA at $0.1990, up 3.79% in 24 hours, ranked 15th with a $7.33B market cap.
Volume jumped 33.79% to $326.11M, so the bounce had real participation behind it.
Supply sits at 36.82B ADA of a 45B max, and FDV (fully diluted value, the cap if every coin existed) reads $8.95B.
But 30 days still show -26.29%, and year-to-date read -40.09%.
Cardano Technical Analysis
30-Minute Chart: Ascending Triangle Under $0.1999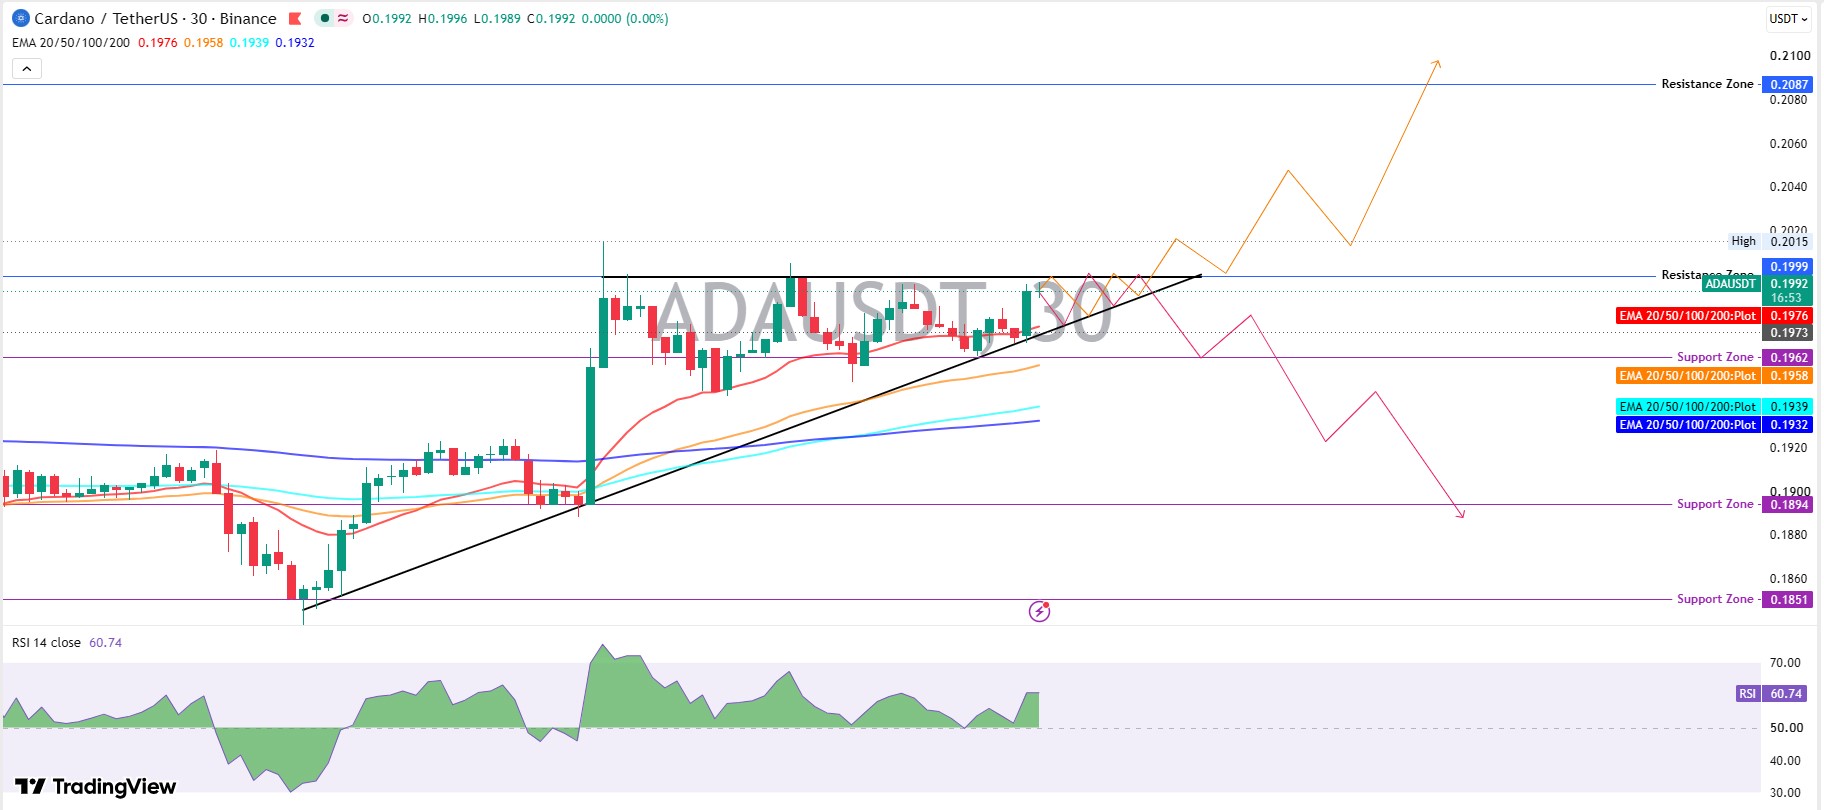
A flat ceiling at $0.1999 and a rising trendline have squeezed the price into an ascending triangle.
Higher lows keep stacking while buyers hit the same wall. On the TradingView chart, the 20 EMA at $0.1976 rises right under price.
RSI at 60.74 backs the push.
Break $0.1999, retest it, and hold it. Then $0.2087 opens.
But a rejection and a slip under $0.1962 flips the script toward $0.1894 and $0.1851.
1-Hour Chart: Buyers Sit Above Every EMA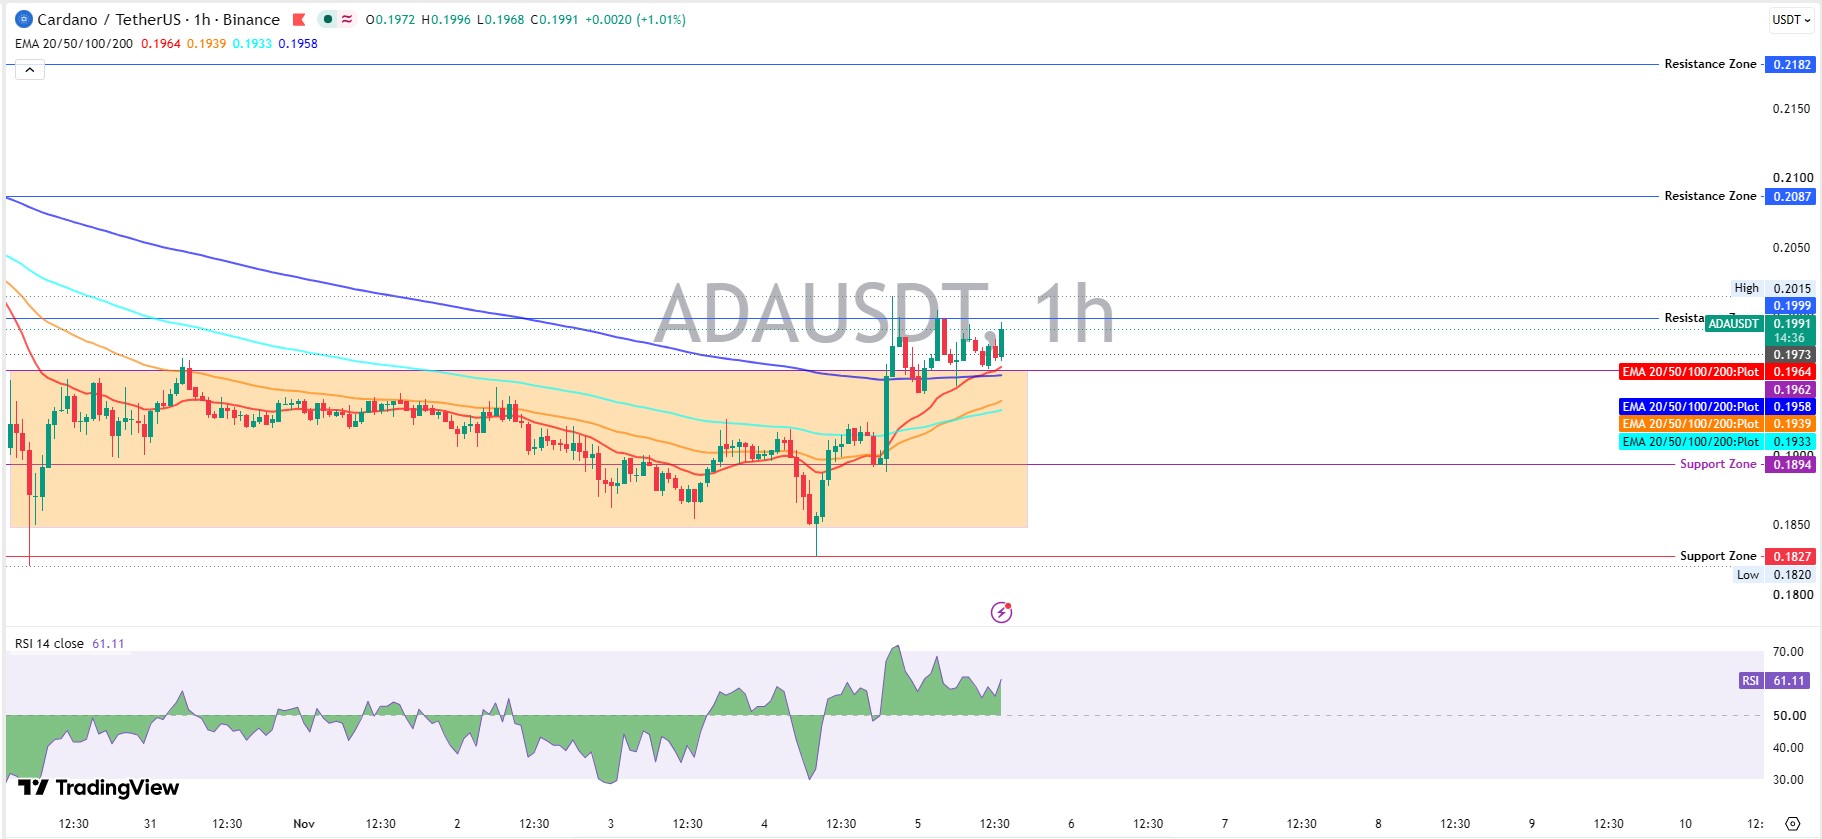
For days, the price stayed trapped under $0.1962. Then on Nov 4, 2026, a single hourly candle spiked to $0.2015.
But buyers couldn't hold above $0.1999, so the price slipped back to $0.1973.
Price now trades above all 4 EMAs, led by the 20 EMA at $0.1964, a lot like the 100 EMA reclaim setup.
RSI reads 61.11, down from a spike above 70, so momentum's warm and room remains.
Cardano Price Analysis: Daily Chart From $0.2824 to the Wedge Exit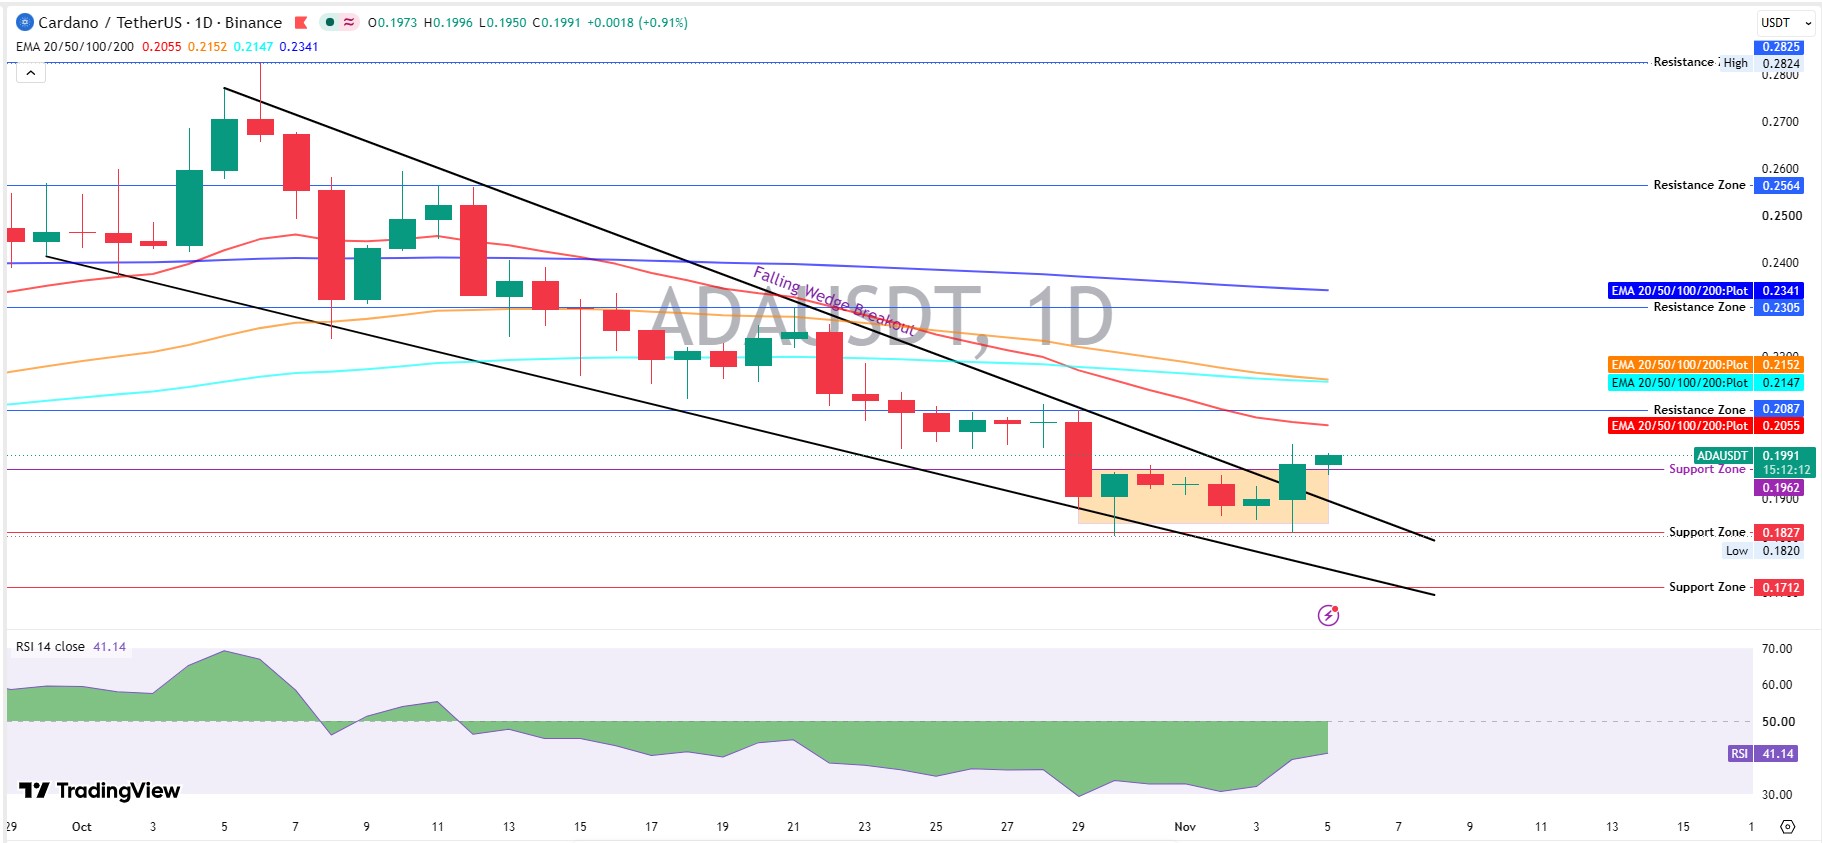
The Oct 6, 2026, daily candle tagged $0.2824, and sellers grabbed control right there.
Price then slid inside a falling wedge, where both trendlines point down but squeeze together. Those often end with an upside break.
Every bounce stalled under the 20 EMA, now $0.2055. An EMA is an average that weighs recent trades more, and the 50 EMA at $0.2152 sits higher still.
Then Oct 29, 2026, brought a large red candle that dropped price into a tight range.
Candles opening Oct 30 and Nov 4, 2026, both wick into the $0.1820 to $0.1827 support zone.
Buyers answered both times, much like the descending channel near $0.1820 setup.
And Nov 4's candle finally punched through the upper wedge line, a falling wedge breakout that buyers had earned with two defended lows.
Nov 5, 2026, opened at $0.1973, traded between $0.1950 and $0.1996, and now sits at $0.1991.
Daily RSI reads 41.14. That's under 50, and the price still trades under the 20 EMA.
Derivatives Data: Shorts Took the Pain
Shorts got hit. CoinGlass liquidation data shows $1.19M wiped out in 24 hours.
Shorts made up $1.06M of that.
Longs lost just $128.98K. Open interest, the value of live futures bets, sits at $400.74M.
Futures volume of $462.69M dwarfs $68.65M in spot.
Accounts lean long, with a long-to-short ratio of 2.0618 on Binance and 2.37 on OKX.
Crowded longs need price to keep climbing. And a stall at $0.1999 would hurt them first.
Market Backdrop: ADA Moves With the Pack
Bitcoin trades at $80,419.43, up 2.63%, and Ethereum gained 4.17% to $2,413.76.
Solana added 3.82% at $96.59, and Avalanche lagged at 0.85%.
ADA held the floor from its earlier $0.1820 support test, so the 3.79% gain sits mid-pack.
Is that enough to carry the price through $0.1999?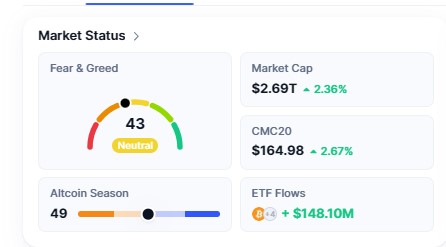
Fear and Greed reads 43, neutral, so nobody's chasing yet. ETF flows show +$148.10M.
On-Chain Pulse: What Cardano's Network Shows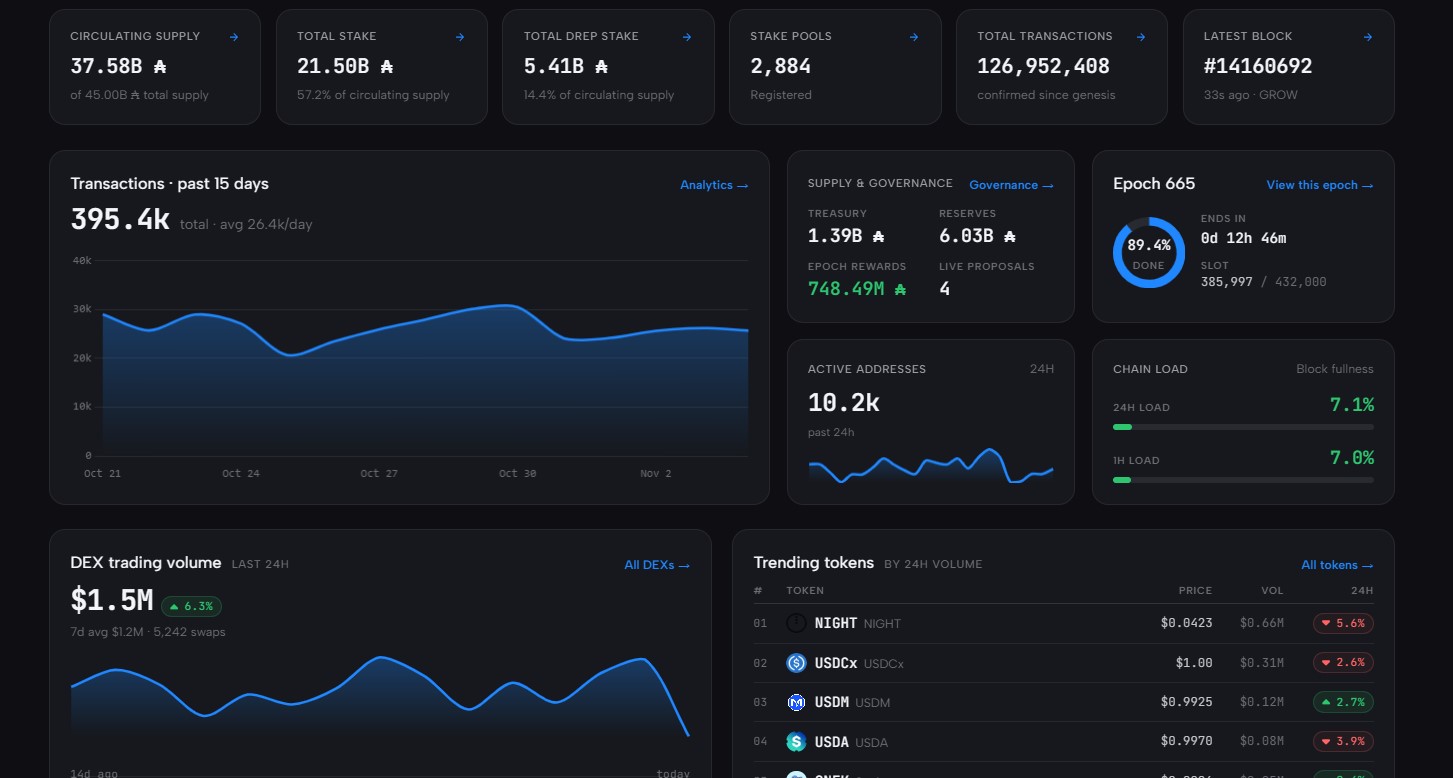
Cardanoscan network data shows 21.50B ADA staked (coins locked to secure the network), 57.2% of circulating supply, so more than half sits locked in staking.
Activity is steady, with about 10.2k active addresses over 24 hours.
DEX (decentralized exchange) volume reached $1.5M, up 6.3% against a 7-day average of $1.2M.
That's tiny next to $326.11M in total ADA volume, so exchange flows drive this move, not on-chain demand.
Cardano Price Prediction: Bull and Bear Paths From $0.1999
This Cardano price forecast maps 2 paths, and the range breakout or breakdown playbook fits both.
If ADA keeps trading above $0.1962, then bulls keep control.
Buyers own this setup. Then again, scratch that, since daily RSI at 41.14 says they're only halfway there.
Scenario | Trigger | Target | Invalidation | Liquidity Condition |
Bull | Trades above $0.1999 and holds a retest | $0.2087, then $0.2182 | Trades under $0.1962 | Volume above the $326.11M daily level |
Base | Chops between $0.1962 and $0.1999 | $0.1973 to $0.1991 | Breaks either edge | Futures volume stays near $462.69M |
Bear | Rejected at $0.1999, then slips under $0.1962 | $0.1894, then $0.1851 | Trades back above $0.1999 | Long liquidations rise past $128.98K |
Key Levels to Watch
Cardano Price Outlook: Support Ladder
Support runs $0.1962, $0.1894, $0.1851, and $0.1827, with $0.1712 as the daily floor if the range fails.
Resistance Ladder
Resistance starts at $0.1999, then $0.2015, $0.2087, and $0.2182. The 200 EMA resistance at $0.2341 on the daily chart sits far above.
Risks That Can Flip the Setup
Any Cardano price projection has to respect crowded longs, because a rejection at $0.1999 sends the price toward $0.1962 fast.
If Bitcoin rolls over from $80,419.43. Altcoins usually feel that first.
But the daily trend remains the weak spot, and the longer monthly view needs a reclaim of the 20 EMA at $0.2055.
Final Verdict
This Cardano price prediction stays bullish above $0.1962, with $0.1999 as the gate and $0.2087 as the first target.
A trade under $0.1962 flips the bias.
Disclaimer: This article is for information only and isn't financial advice. Crypto markets move fast, and prices can reverse without warning. Readers should research independently and manage risk before trading.
0
0

 Manage all your crypto, NFT and DeFi from one place
Securely connect the portfolio you’re using to start.


