
Litecoin Price Prediction November 2026: Can LTC Reclaim $74.53?

0
0

Will Litecoin hold $53.77 or slide toward $47.56 next?
This Litecoin Price Prediction November 2026 weighs the daily chart, ETF data, and derivatives together. LTC trades at $55.69 as of 06:20 UTC, and the 50-day EMA is the first test.
Longer targets sit in this LTC long-term price targets piece.
Litecoin Price Forecast: 24-Hour Market Snapshot
CoinGecko market data puts LTC at $55.69 as of 06:20 UTC.
Metric | Value |
LTC price | $55.69 |
Market cap | $4.364B |
FDV | $4.364B |
24h trading volume | $345.459M |
Total supply | 77.774M LTC |
Max supply | 84M LTC |
Source: CoinGecko, captured Oct 30, 2026, 06:20 UTC.
FDV is price times total supply. It equals market cap since nearly every coin already circulates.
LTC Price Performance and Support Levels
Coinglass price performance data, captured at 06:20 UTC, shows LTC down 2.18% over 24 hours and 4.42% over seven days.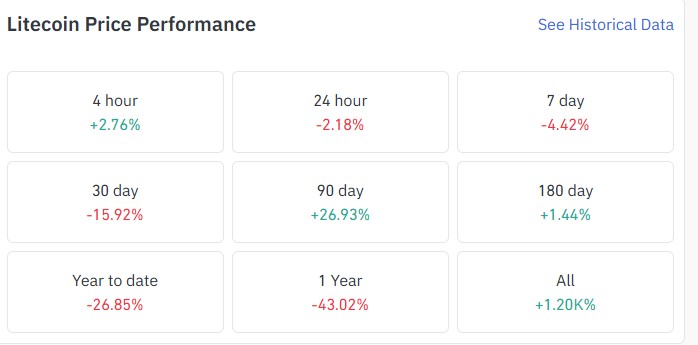
Source: Coinglass, captured Oct 30, 2026, 06:20 UTC.
The last 4h tells a different story, with LTC up 2.76%. That leaves a price of $3.05 above the 24-hour low and $2.61 below the today's high.
And the 90-day return is still 26.93%. But a 30-day loss of 15.92% shows the pullback is recent.
Litecoin ETF Flows Stay Flat
SoSoValue ETF data as of Oct 29, 2026, captured at 06:20 UTC, shows cumulative net inflow sits at $16.61M.
Source: SoSoValue, data as of Oct 29, 2026, captured Oct 30, 2026, 06:20
ETF net assets, the total value of fund holdings, stand at $13.07M. That's 0.31% of LTC market cap. A $0.00 print means no fresh fund demand.
Canary's LTCC on Nasdaq trades at a 0.28% premium.
Net assets trail cumulative inflow by $3.54M, a gap that price declines can explain. Other fund headlines sit in crypto news coverage.
Litecoin Liquidation Data Shows Longs Hit
Longs took the hit. Per Coinglass liquidation data, captured at 06:20 UTC, liquidations reached $3.65M over 24h.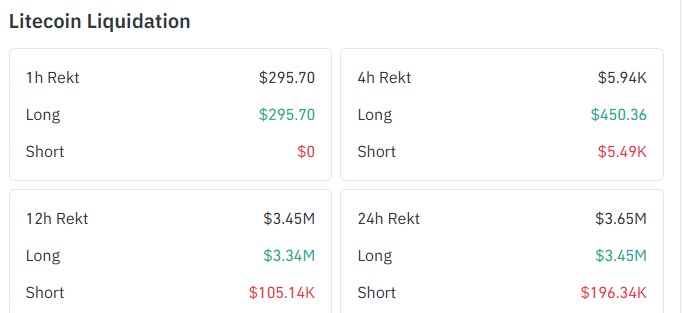
Source: Coinglass, captured Oct 30, 2026, 06:20 UTC.
A liquidation is a forced exit from a leveraged trade once margin runs out. Longs lost $3.45M of the total, shorts $196.34K.
Most of it landed in the 12h window, where longs lost $3.34M. Over the last 4h, shorts led with $5.49K against $450.36 for longs. But the latest 1h shows $295.70, all longs.
Litecoin Open Interest and Futures Volume
Open interest is the total value of futures contracts still open. CoinGecko's perpetual futures figure shows $684.891M.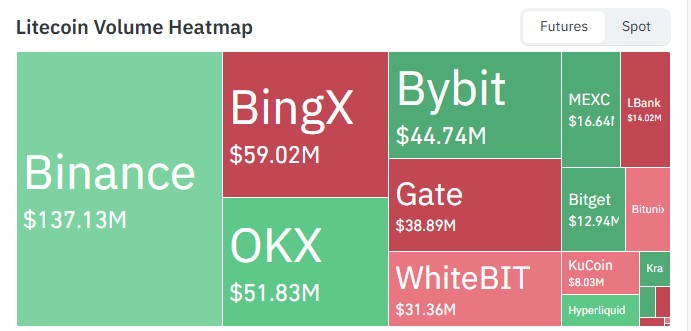
Source: Coinglass, captured Oct 30, 2026, 06:20 UTC.
Coinglass futures volume, captured at 06:20 UTC, ranks Binance first at $137.13M. BingX follows at $59.02M.
Why does that lead matter? Binance trades 2.3 times BingX's volume. Other coin setups sit under altcoin analysis.
Litecoin Chart Analysis With RSI and 50-Day EMA
TradingView's Bitstamp daily chart frames this Litecoin Price Prediction November 2026.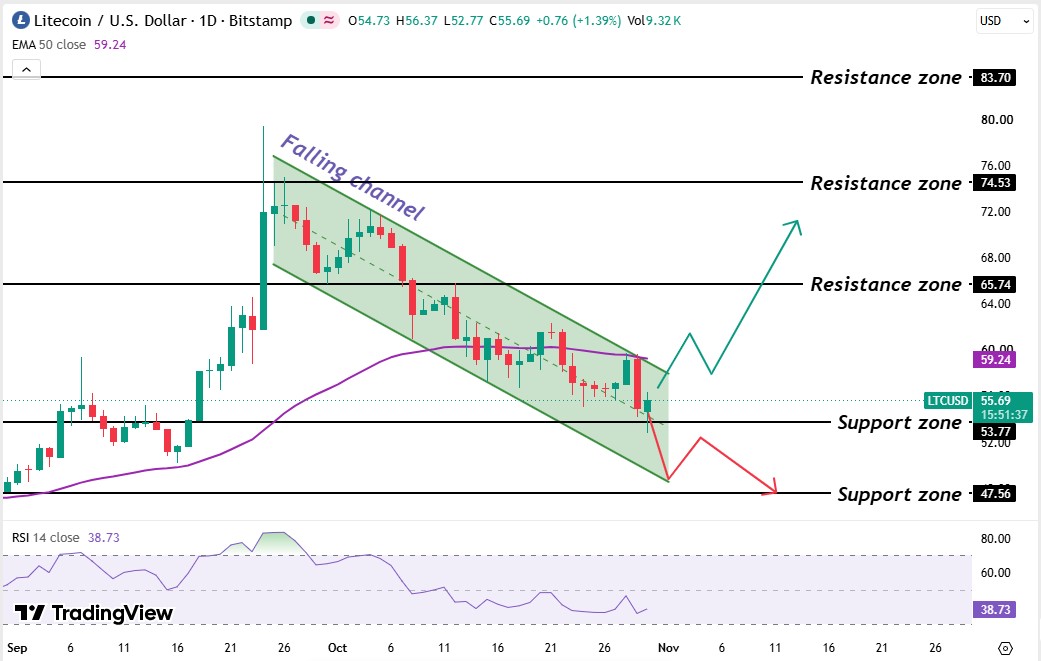
Source: TradingView, captured Oct 30, 2026, 06:20
Starting in early September, LTC traded near the $53.77 level and above the 50 EMA for a few days, then broke out toward the high $74.53 level and made a wick but closed below that level.
After that, the price started going downward by making the lower high and lower lows and formed a channel. A falling channel (meaning lower highs and lows between two sloping lines).
The price is rejected by the 50 EMA on 28 Oct while trying to break the channel, and right now the price is testing the $53.77 support level.
The 50-day EMA sits at $59.24 and has flattened. So sellers keep the edge until a daily candle trades above it.
RSI (the relative strength index) reading of 38.73 sits under 50, so momentum favors sellers. It's still above 30, the oversold line.
Litecoin Support Levels and Resistance Levels
Type | Level |
Resistance | $83.70 |
Resistance | $74.53 |
Resistance | $65.74 |
50 EMA | $59.24 |
Support | $53.77 |
Support | $47.56 |
Nearest levels are $59.24 above and $53.77 below.
LTC Bull, Base, and Bear Scenarios
Scenario | Trigger | Target | Invalidation |
Bull | Daily candle trades above $59.24 | $65.74-74.53 | Daily candle trades below $53.77 |
Base | Price holds between support and 50 EMA | $53.77 to $59.24 | Daily candle trades outside range |
Bear | Daily candle trades below $53.77 | $47.56 | Daily candle trades above $59.24 |
This Litecoin price prediction keeps the base case until a 50 EMA level breaks.
Regulatory delay could keep ETF flows at $0.00. An outflow from the $13.07M fund would remove a small bid. And a daily candle below $53.77 invalidates the base case.
Litecoin Price Prediction November 2026: Expert Outlook
As per CoinGabbar analysis, the evidence leans bearish while LTC trades under the $59.24 EMA. RSI at 38.73 and $3.45M in long liquidations point the same way.
That stance anchors this Litecoin price prediction November 2026. A bounce from $53.77 reads as relief until buyers reclaim the 50 EMA level.
A break of the $53.77 level support favors the sellers. Rising open interest with a daily candle above it means shorts are being squeezed.
Disclaimer: This article is for information only and isn't financial advice. Traders should do their own research and risk only what they can afford to lose.
0
0

 Manage all your crypto, NFT and DeFi from one place
Securely connect the portfolio you’re using to start.


