
Price Prediction 11/13: BTC, ETH, BNB, XRP, SOL, HYPE

0
0

SOL experienced another significant selloff on Friday, driving prices to new lows. It is now down more than 2% on the 1-day scale, but shows signs of a pullback.
SOL is nearing the end of the session, marking its second day of notable losses. In hindsight, the week has been mostly bearish for the asset. However, the conditions affecting the coin are not isolated.
The global cryptocurrency market is heading into the weekend down almost 7%. It also saw notable losses over the last 48 hours, and buybacks are gradually being spread across several assets. It remains uncertain if the newfound buying pressure will last through the next two days.
With the market set to close the first five days of the week with such losses, it’s important to review some events that may have contributed to the downtrend.
The issue surrounding NVIDIA was the biggest catalyst for selling. On Friday, selling pressure spilled over from the previous day’s sentiment. While a rebound followed the first wave of selloffs, the PPI report Y/Y% came in higher, coinciding with the second round of selling pressure.
Although the bulls are staging rallies at the time of writing, it is important to consider what the charts say about the next price action.
BTC/USD
Bitcoin plummeted by more than 4% on Friday, but is trading above its recent low of $67,500. Like SOL, it is also on the verge of registering its second consecutive day of selloff.
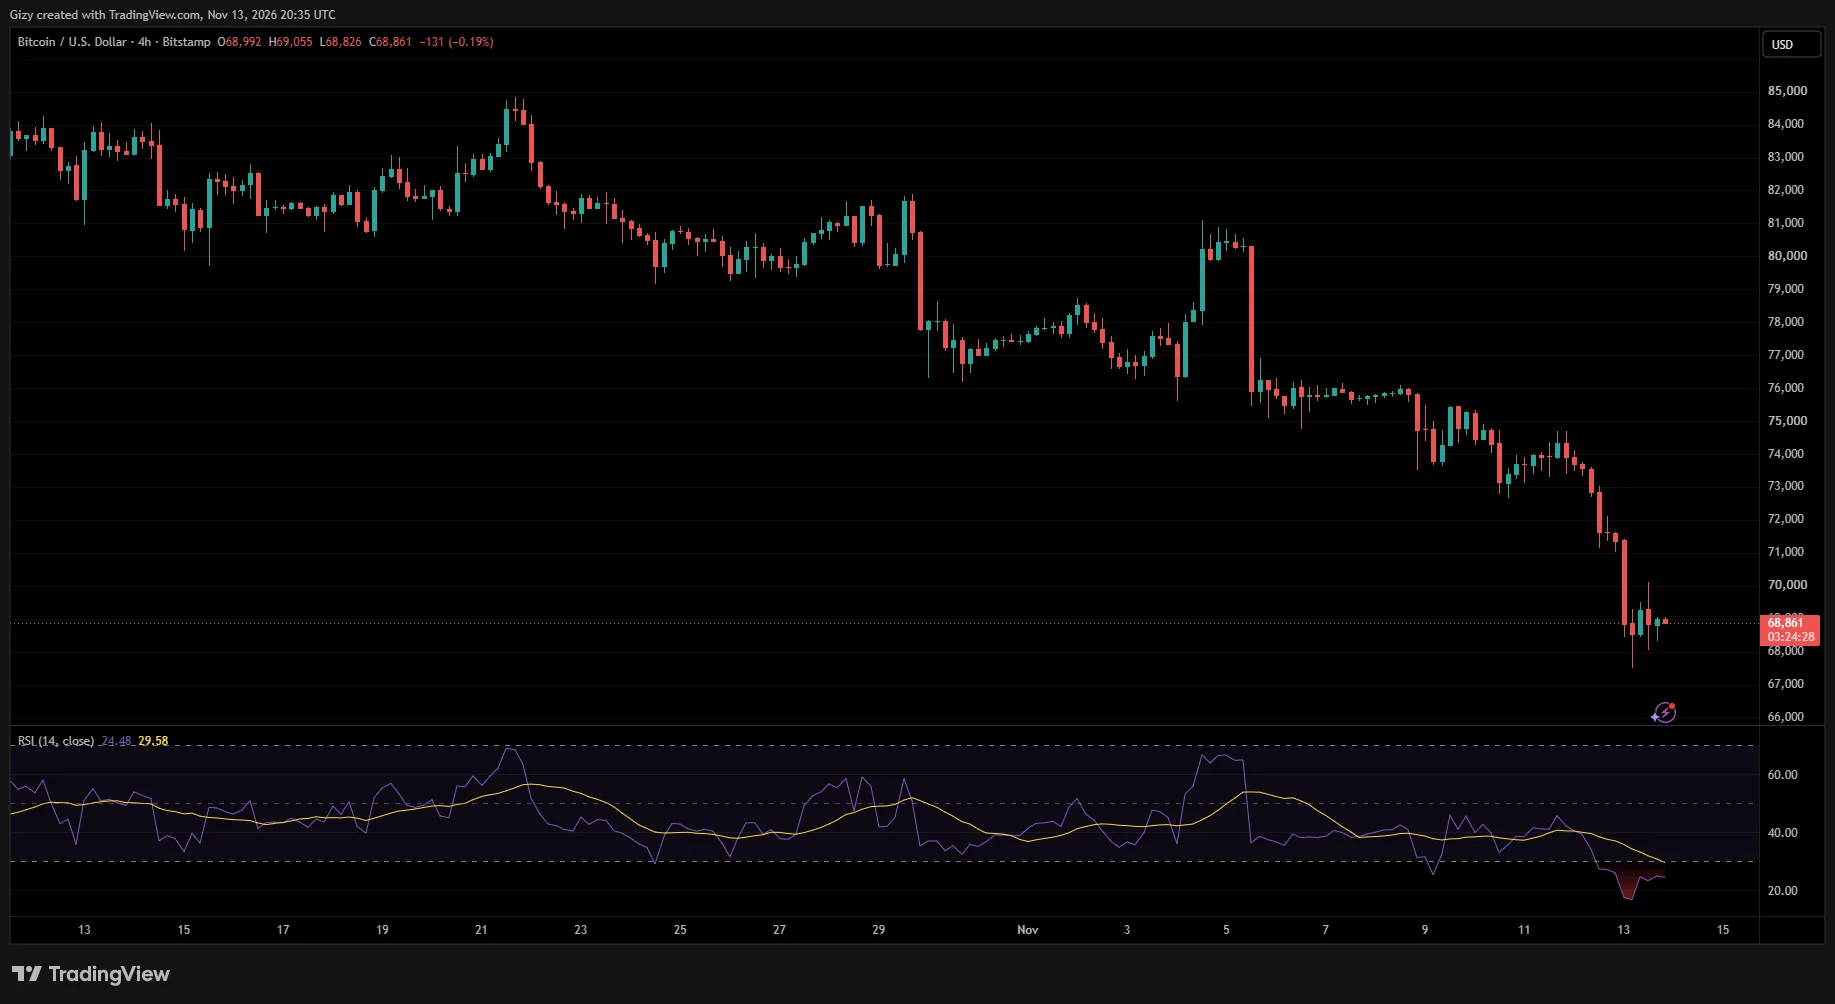
On the 1-day chart, the apex coin is trading far from a tough support level, meaning there’s an increased chance of further downtrend. However, this does not eliminate the likelihood of notable recovery over the weekend.
Interestingly, the 4-hour chart indicates that such buybacks may continue over the next two days. The strongest indicator supporting this view is the relative strength index, which was deep in oversold territory a few hours ago. It is yet to climb back above 30, suggesting further uptrend ahead.
However, weekend events may affect prices on Monday. The dominant trend over the last four weeks is green; Saturday and Sunday may result in a red or doji on Monday. When the situation reverses, Monday is green.
In either case, if the weekend is green, the apex coin may retest $66k at the start of the coming week. Conversely, a red performance over the next two days may see BTC retest $72k on the third day.
ETH/USD
Ethereum is not exempt from the massive bearish sentiment ravaging the crypto market. It also retraced to new lows on Friday and is down by more than 3% at the time of writing.
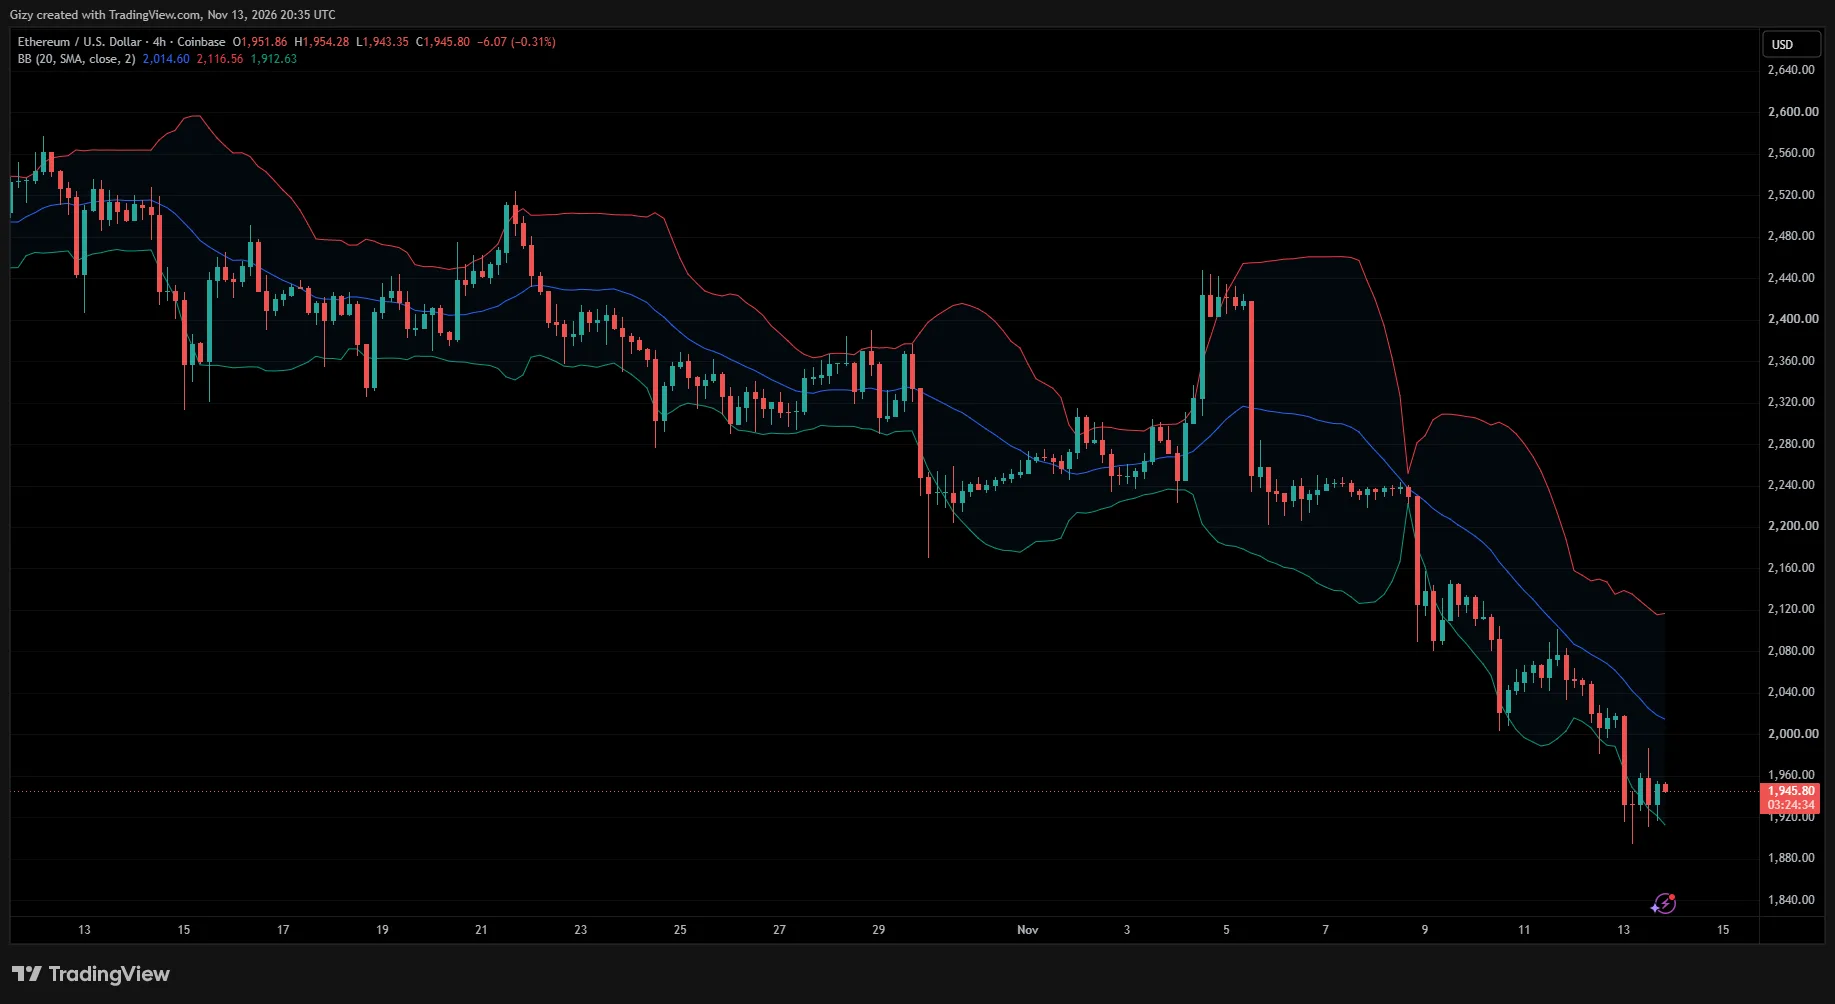
The 1-day chart shows a long wick sticking out from the bottom of the current candle. Its latest rebound is better captured in the 4-hour chart. It prints a green candle, but there’s more. Ether dropped below Bollinger’s lower band a few hours ago, but is trading above it now.
Interestingly, ETH has retested the middle band after slipping out of the bands. If the trend holds, it will retest $2k within the next three days.
BNB/USD
An earlier outlook described a situation in which BNB will slip as low as $660. Friday price action showed that slipping below $685 led to a deeper decline than expected. The asset reached a low of $623, but is currently edging closer to $640.
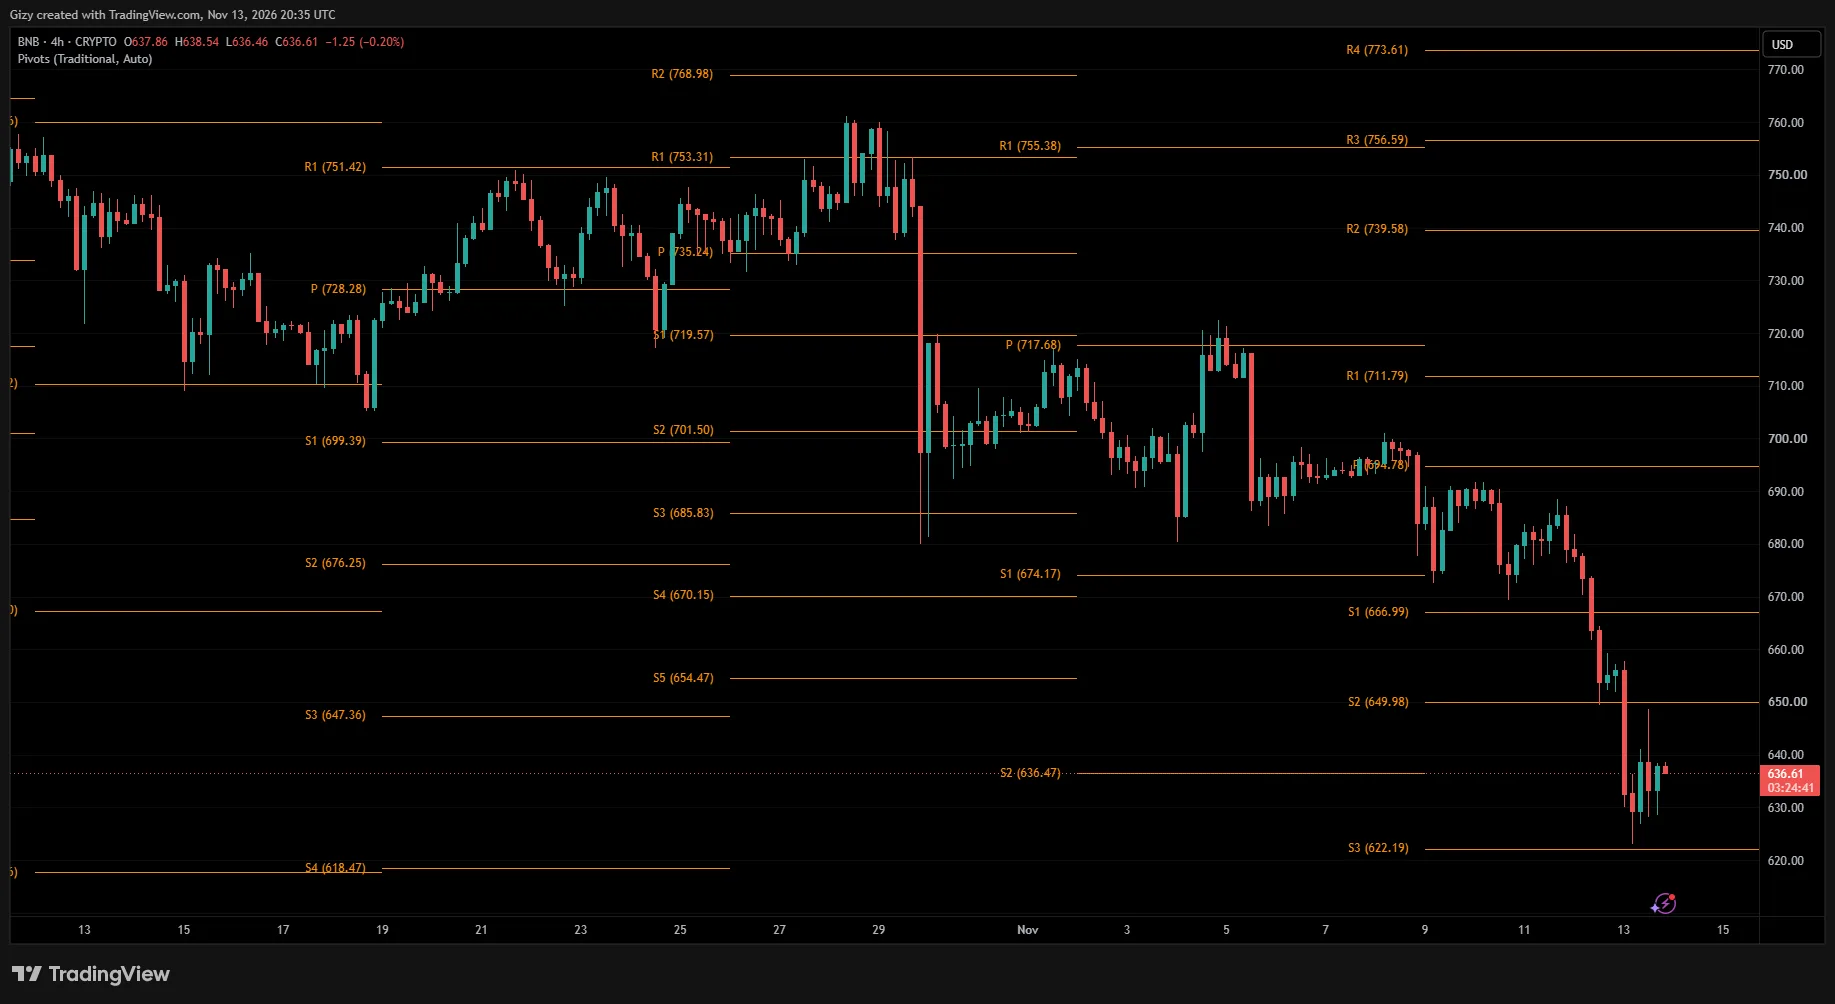
Interestingly, the coin rebounded off the first pivot support in the early hours and has since traded between the PP and S1. It also faced rejection at the pivot point and is gearing up for another retest.
If BNB flips $650, it will likely retest $670 in the coming days. Conversely, failing to stay above S1 may send prices below $600.
XRP/USD
XRP briefly slipped below $1 a few hours ago and has sharply recovered. The 1-day chart shows that it pulled back more than half of its previous losses. Nonetheless, it may end the day down by almost 2%.
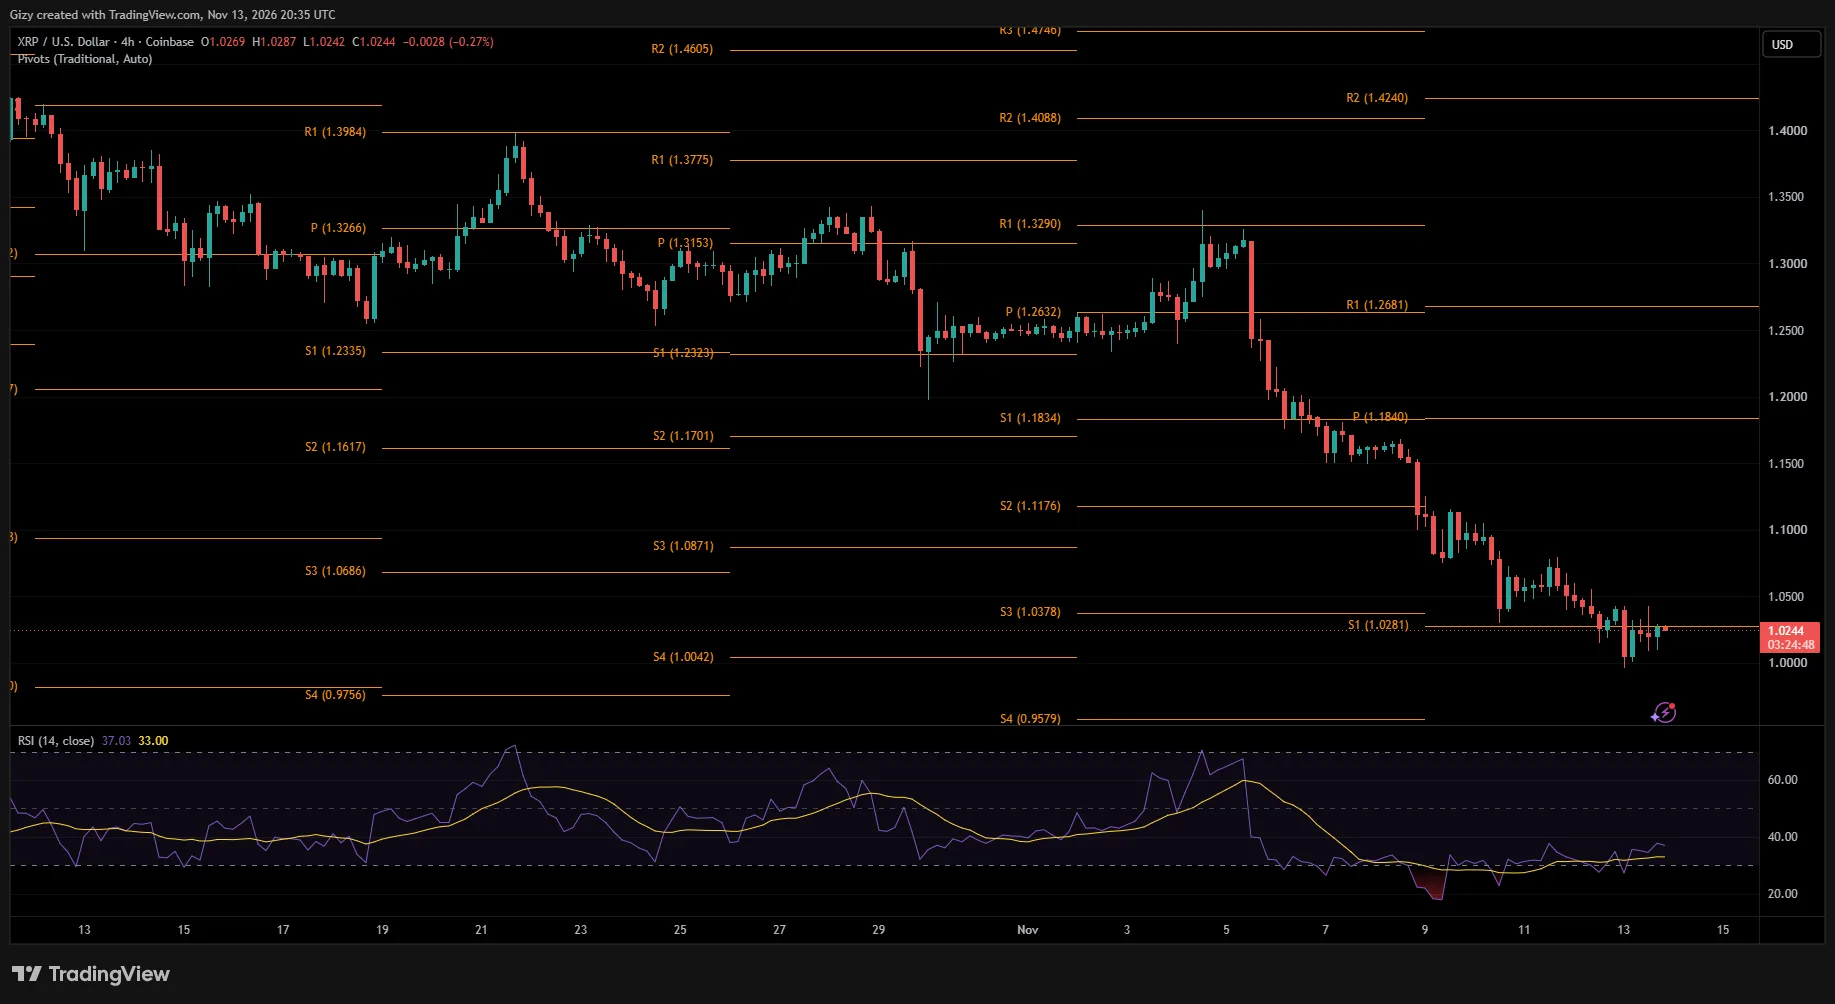
Amid its rebound, the 4-hour chart shows that it is struggling to break above S1. It has spent most of the last 24 hours below this mark, indicating notable selling congestion. If the struggle continues, a drop to $0.95 may follow.
However, RSI suggests a high likelihood of the bulls breaking above this key level. If that happens, a surge to $1.08 is likely.
SOL/USD
SOL was previously oversold on the 4-hour chart, with RSI dropping below 30. The metric is back above the mark and in the slightly neutral region. However, it still has room for improvement. If prices play out accordingly, the altcoin will look to reclaim the $83 barrier.
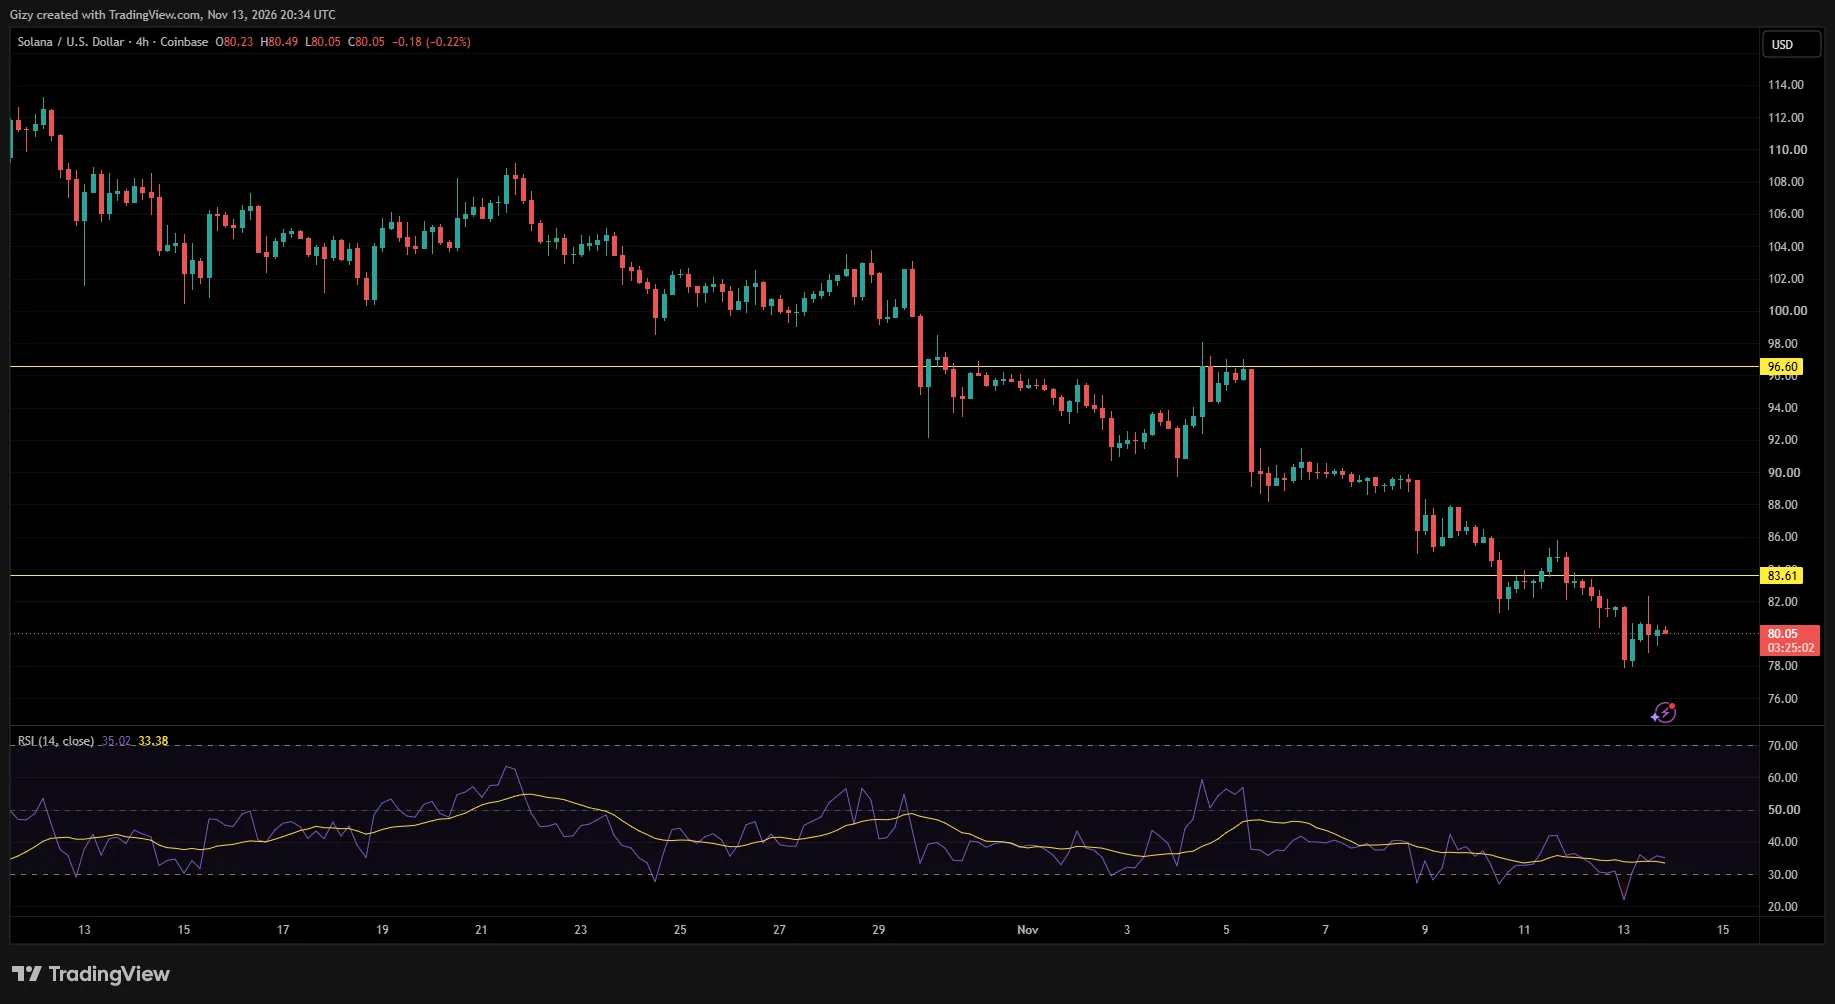
Reflecting on Friday’s price action, the altcoin dropped to a low of $77. Its recent dip is unsurprising, as a previous analysis indicated a high likelihood of such a decline happening. It also predicted further retracement to $72, but that is unlikely this weekend.
The 4-hour chart shows that SOL is still grappling with muted volatility. If the trend continues over the weekend, a correction to $76 remains possible.
HYPE/USD
HYPE is one of the few coins that flipped green on Friday. However, it prints a doji. The previous intraday session also ended with no notable gains.
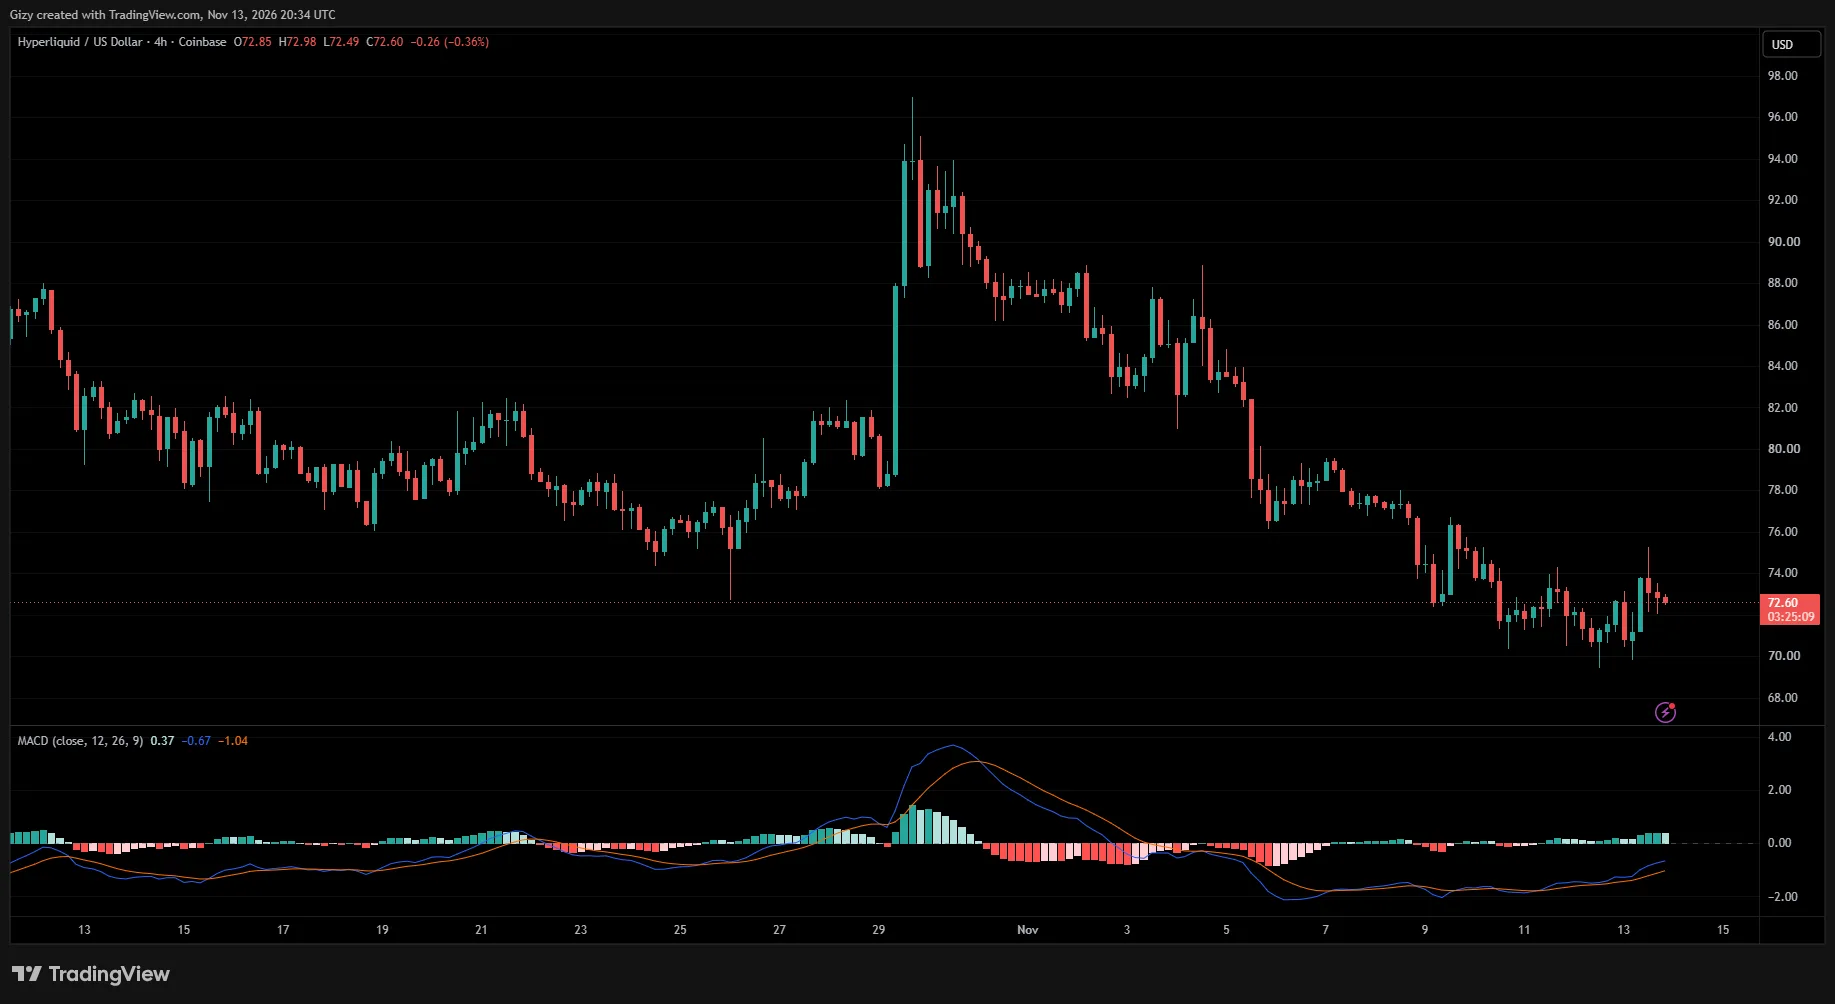
On th e 4-hour chart, the altcoin is maintaining a gradual uptrend. Additionally, the moving average convergence divergence also had a bullish crossover.
MACD’s recent signal suggests potential price surges, but it remains uncertain if the bulls will stage rallies in the coming hours. If they do, HYPE will retest $76 within the next three days. Conversely, the downside risk is not zero. A drop below $70 remains on the table.
The post Price Prediction 11/13: BTC, ETH, BNB, XRP, SOL, HYPE appeared first on CoinTab News.
0
0


 Manage all your crypto, NFT and DeFi from one place
Securely connect the portfolio you’re using to start.
 Where will Bitcoin trade next?
Live Polymarket and Kalshi odds on Bitcoin price targets, compared side by side.
See Bitcoin price odds


